Early Warning Signs of Adhesive Bond Degradation in Service: What to Monitor and When to Act
A Monitoring Framework for Detecting Bond Strength Loss Before Catastrophic Failure
Summary: Adhesive bonds in structural and semi-structural applications undergo gradual strength loss before sudden failure, creating a hidden degradation window that maintenance programs typically miss. Moisture diffusion, interfacial corrosion, UV chain scission, and thermal cycling fatigue each produce detectable precursors before bond failure occurs. This article presents a bond health monitoring protocol with visual indicators, non-destructive test methods, and environmental exposure tracking to estimate remaining bond life and determine appropriate inspection intervals and action thresholds.
Table of Contents
I. The Hidden Degradation Window
II. Degradation Mechanism 1: Moisture Diffusion and Interfacial Attack
III. Degradation Mechanism 2: UV-Induced Chain Scission
IV. Degradation Mechanism 3: Thermal Cycling Fatigue
V. Monitoring Framework: Indicators, Methods, and Thresholds
VI. NDT Methods for Bond Inspection: Capabilities and Limitations
VII. Industry Patterns: Lessons from Aerospace, Automotive, and Marine
VIII. Field-Practical Inspection Techniques
IX. Key Takeaway
X. References
I. The Hidden Degradation Window
Adhesive bond failure in service is rarely instantaneous. Before catastrophic failure, the bond passes through a degradation phase where strength decreases progressively over months or years. During this phase, the bond appears intact on visual inspection but its actual strength may have decreased by 30 to 60 percent. Conventional maintenance programs are not designed to detect this gradual loss.
The degradation trajectory follows a characteristic pattern. Initial exposure produces reversible changes: slight plasticization, minor swelling, small shifts in mechanical properties. Over time, irreversible damage accumulates as polymer chains break, interfaces corrode, and micro-cracks grow. The bond reaches a tipping point where a single additional stress event triggers rapid failure propagation. The gap between that tipping point and the onset of irreversible damage is the hidden degradation window where intervention remains possible.
Why Proactive Monitoring Matters
Early detection enables planned repairs during scheduled maintenance windows rather than emergency shutdowns. Emergency bond failure repairs typically cost five to ten times more than planned maintenance, accounting for production downtime, expedited material procurement, overtime labor, and quality re-verification. In safety-critical applications, bond failure can trigger regulatory reporting requirements, fleet-wide inspections, and potential service bulletins.
The Degradation Timeline
Not all bonds degrade at the same rate. A structural epoxy in an indoor, climate-controlled environment may retain 90 percent or more of its strength for decades. The same chemistry on a marine vessel hull may lose 50 percent of its bond strength within three to five years. The degradation timeline depends on three factors: adhesive chemistry, substrate materials, and environmental exposure profile.
II. Degradation Mechanism 1: Moisture Diffusion and Interfacial Attack
Moisture is the single most common cause of adhesive bond degradation in service. Water molecules are small enough to diffuse through virtually all polymer adhesives, and their presence initiates multiple degradation pathways simultaneously.
The Diffusion Process
Water transport into adhesive bonds follows predictable physics. In most structural adhesives, initial moisture uptake follows Fickian diffusion, where the rate of absorption is proportional to the concentration gradient and the diffusion coefficient of the polymer. The diffusion coefficient for water in epoxy adhesives typically ranges from 1 x 10^-13 to 1 x 10^-12 m^2/s at room temperature, increasing by roughly an order of magnitude for every 20 to 25 degrees Celsius rise in temperature. This means that an epoxy bond line 0.5 mm thick will reach moisture equilibrium in approximately 6 to 12 months at ambient conditions, but in as little as 2 to 4 weeks at 60 degrees Celsius.
Research on aerospace applications has confirmed that Fickian and Langmuir models describe moisture uptake in structural adhesives and carbon/epoxy composites, with temperature dependence following Arrhenius kinetics. Some adhesive systems exhibit anomalous (non-Fickian) diffusion when micro-damage creates preferential transport pathways, which itself can be an indicator that degradation has begun.
Bulk Plasticization
Water absorbed into the adhesive bulk acts as a plasticizer, increasing chain mobility and reducing the glass transition temperature (Tg). A 2 percent moisture uptake by weight can reduce Tg by 10 to 20 degrees Celsius (MDPI Polymers, 2023). This is partially reversible upon drying, but repeated wet-dry cycles cause cumulative damage through hydrolysis of susceptible crosslinks.
The practical significance is substantial. If a structural epoxy has a dry Tg of 120 degrees Celsius and operates at 80 degrees Celsius, it has a 40-degree safety margin. Moisture uptake of 2 percent reduces that margin to 20 to 30 degrees. In hot climates or near heat-generating equipment, the bond temperature may approach the wet Tg, causing dramatic softening and creep.
Water molecules also participate in hydrolysis reactions that permanently cleave ester and amide linkages in the polymer network. Ester-containing adhesives (polyesters, some modified epoxies) are more susceptible than ether-linked systems. Each hydrolysis event permanently reduces crosslink density, lowering strength and stiffness even if the bond is subsequently dried.
Interfacial Corrosion
The most dangerous degradation occurs at the adhesive-metal interface. Water that reaches the interface displaces adhesive-substrate bonds and, on active metals such as steel and aluminum, initiates corrosion. The corrosion products (iron oxide, aluminum hydroxide) occupy more volume than the original metal, creating mechanical stress that propagates delamination. This process is invisible from the exterior but can reduce bond strength by 50 percent or more.
On aluminum substrates, bayerite (aluminum trihydroxide) crystals grow as needle-like structures that physically push the adhesive away from the metal surface. Surface pretreatments such as phosphoric acid anodizing (PAA) and chromic acid anodizing (CAA) create stable oxide layers that resist this, which is why aerospace specifications mandate these treatments for primary bonded structures. On steel substrates, once rust is visible at the bond perimeter, the corrosion front has typically advanced several millimeters beyond what is visible due to the cathodic delamination mechanism.
Visual Indicators
Edge whitening or cloudiness at bond line perimeters indicates moisture ingress into the adhesive. Blistering at the bond surface indicates moisture accumulation at the adhesive-substrate interface. Rust staining visible at bond line edges on steel substrates indicates interfacial corrosion. Swelling or dimensional changes in the bond line region indicate significant moisture uptake. Any of these signs warrants immediate detailed inspection of the bond.
III. Degradation Mechanism 2: UV-Induced Chain Scission
Adhesive bonds exposed to direct sunlight or artificial UV sources undergo photodegradation through chain scission, where UV photons break polymer backbone bonds.
The Mechanism
UV radiation with wavelengths between 290 and 400 nm has sufficient energy to break carbon-carbon and carbon-oxygen bonds in most polymer adhesives. The bond dissociation energy of a C-C bond is approximately 346 kJ/mol, while UV photons at 300 nm carry approximately 399 kJ/mol, sufficient to initiate bond breakage. Each breakage reduces the polymer's molecular weight and creates free radicals that initiate auto-oxidation chain reactions, generating further radicals.
The surface layer (top 0.1 to 0.5 mm) degrades most rapidly, becoming chalky, brittle, and prone to micro-cracking that can propagate into the bulk under mechanical loading. Aromatic polyurethanes are particularly susceptible (yellowing and embrittlement), while aliphatic polyurethanes and silicone adhesives have better UV resistance.
The Depth Profile and Synergistic Effects
UV degradation creates a damage gradient: the outermost 50 to 100 micrometers suffers severe degradation, a transition zone extends another 100 to 400 micrometers, and beyond 0.5 mm depth damage is negligible in opaque adhesives. For thin bond lines (under 0.5 mm) with exposed edges, UV degradation can compromise the full thickness. The resulting edge cracks become stress concentrators and moisture ingress pathways. This synergistic effect between UV damage and moisture ingress is well documented: UV-created micro-cracks dramatically increase the effective diffusion rate of water into the bond.
UV Dose Accumulation
UV degradation is cumulative. Equatorial regions receive approximately 6,000 to 8,000 MJ/m^2 per year, while northern Europe receives approximately 2,500 to 3,500 MJ/m^2 per year. South-facing surfaces receive approximately 1.5 times the UV dose of east- or west-facing surfaces, and altitude increases exposure by approximately 10 to 12 percent per 1,000 meters of elevation.
Visual Indicators
Surface chalking (a powdery, dull appearance) indicates UV degradation of the exposed adhesive surface. Yellowing or color change indicates photo-oxidation. Micro-cracking visible under magnification at the exposed bond line edge indicates advanced UV degradation. Loss of gloss on the adhesive surface is often the earliest detectable sign of UV damage, preceding visible chalking by months. A simple gloss comparison between exposed and protected areas of the same adhesive can serve as a field screening method.
IV. Degradation Mechanism 3: Thermal Cycling Fatigue
Repeated temperature changes create internal stresses in adhesive bonds due to differential thermal expansion between the adhesive and the substrates.
The Mechanism
When temperature rises, the adhesive and substrate expand at different rates (different coefficients of thermal expansion, CTE). This creates shear and peel stresses at the adhesive-substrate interface, concentrated at bond line edges. When temperature drops, the stresses reverse direction. Over thousands of thermal cycles, this alternating stress causes interfacial fatigue that initiates delamination at bond line edges and propagates inward.
For a rigid epoxy (modulus 2 to 3 GPa) bonding aluminum to steel over a 50-degree Celsius temperature range, the interfacial shear stress at the bond edge can reach 5 to 15 MPa, a significant fraction of the adhesive's shear strength. Fatigue damage follows a predictable progression: micro-voids nucleate at bond line edges, coalesce into micro-cracks, and propagate along the interface. The crack growth rate follows Paris-law behavior. As the delaminated area grows, the remaining bonded area carries increasing load, accelerating failure.
The CTE Mismatch Factor
The severity of thermal cycling damage depends on the CTE mismatch between materials. Common CTE mismatch scenarios encountered in industrial applications include:
Material Combination | CTE Difference (ppm/C) | Relative Risk |
|---|---|---|
Steel to steel | 0 | Low |
Aluminum to aluminum | 0 | Low |
Aluminum to steel | 11 | Moderate |
CFRP to aluminum | 17 to 21 | High |
CFRP to steel | 6 to 10 | Moderate to high |
Glass to metal | 14 to 20 | High |
Ceramic to metal | 10 to 18 | High |
Elevated temperature curing produces tensile residual stresses due to CTE differences. These stresses are present before any service cycling begins, effectively reducing the bond's fatigue life.
Temperature Rate Effects
The rate of temperature change matters in addition to the range. Rapid thermal transitions create thermal gradients through the bond thickness, adding peel stress to CTE-generated shear stress. Industrial environments with rapid heating (process vessels cycling between ambient and operating temperature within minutes) impose more severe conditions than gradual outdoor changes. Faster cycling and ramp rates favor selection of lower-modulus, more flexible adhesive systems.
Visual Indicators
Edge cracking at bond line terminations indicates thermal fatigue. Delamination visible as a change in tap-test response (hollow sound instead of solid) at bond edges indicates interfacial fatigue propagation. Adhesive squeeze-out at bond edges that was originally intact but now shows cracking or separation from the substrate is a reliable early indicator of thermal cycling damage.
V. Monitoring Framework: Indicators, Methods, and Thresholds
A practical bond health monitoring program combines visual inspection, non-destructive testing, and environmental exposure tracking.
Figure 1. Bond Strength Degradation Over Time by Mechanism
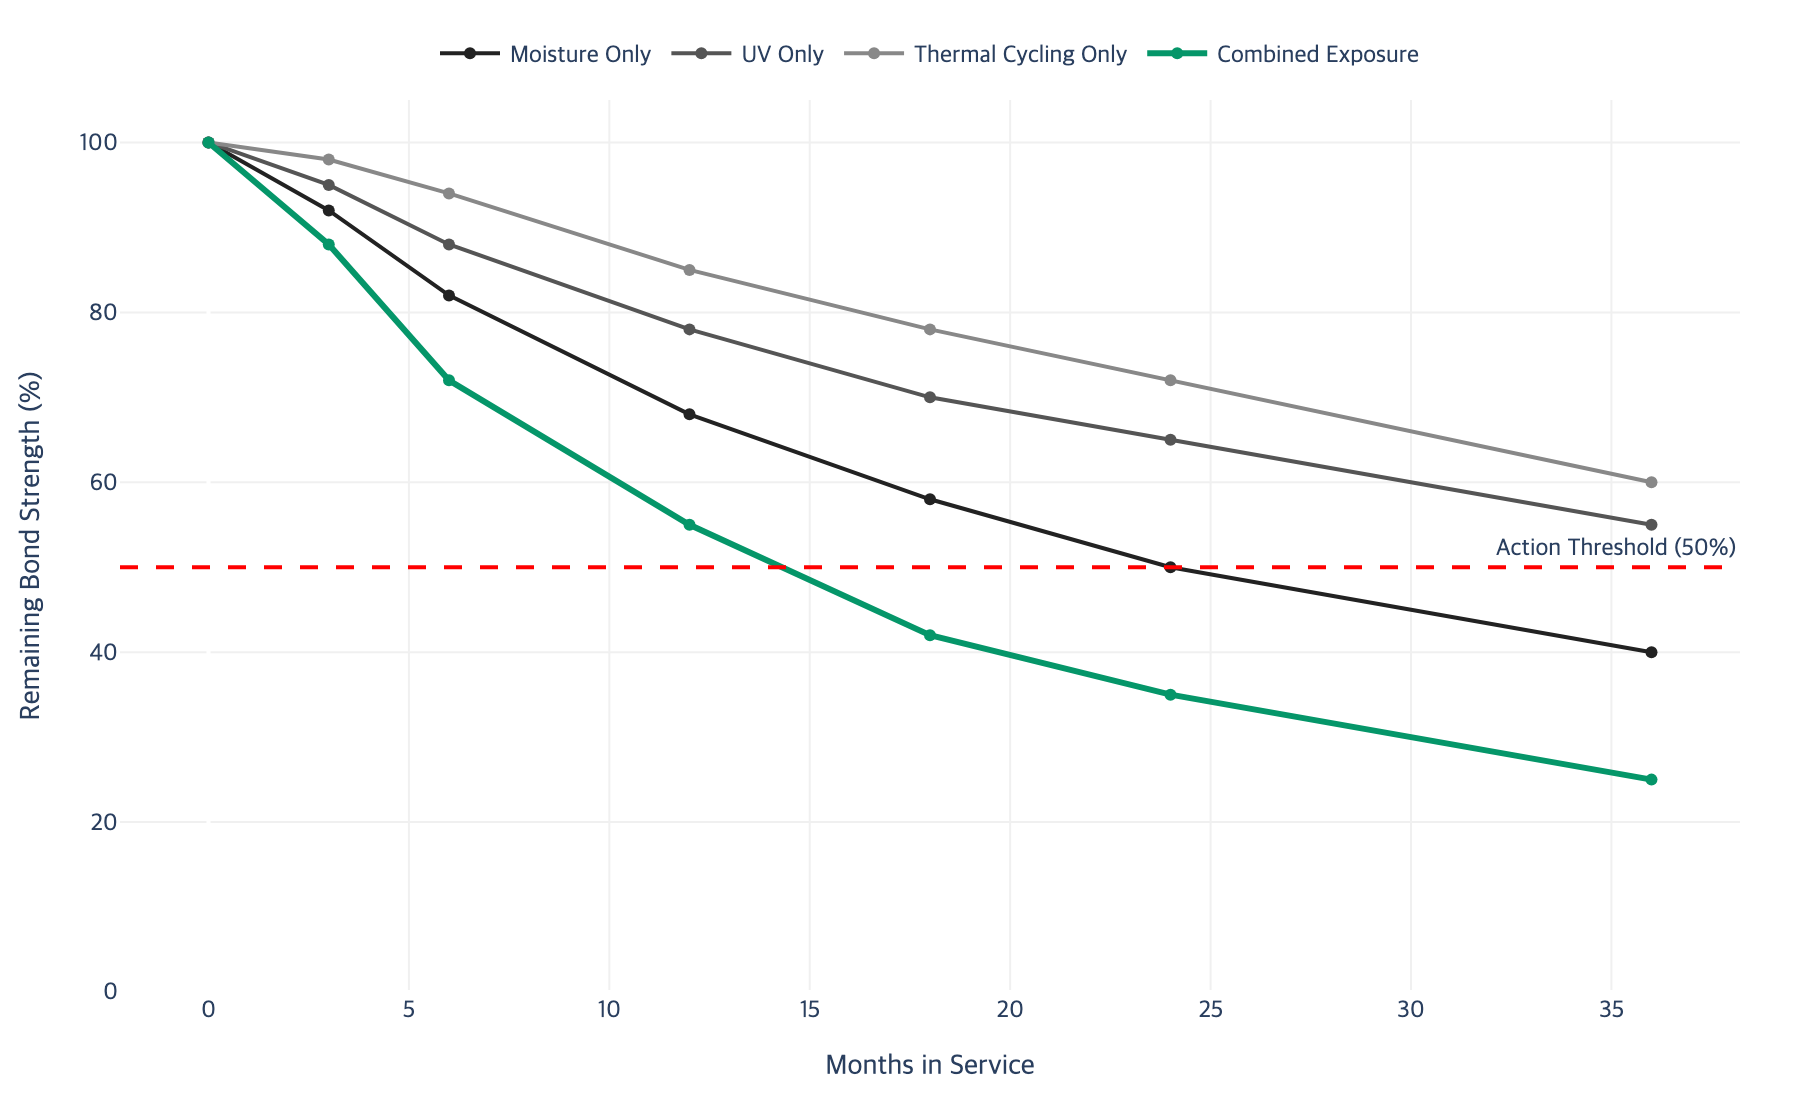
Figure 1b. Bond Health Monitoring Protocol
Inspection Method | What It Detects | When to Use | Action Threshold |
|---|---|---|---|
Visual inspection | Edge cracking, blistering, discoloration, chalking | Every scheduled maintenance | Any visible change triggers detailed inspection |
Tap testing (coin tap) | Delamination, void growth | Quarterly for critical bonds | Hollow response in previously solid areas |
Ultrasonic C-scan | Internal delamination, moisture accumulation | Annually for structural bonds | Delaminated area exceeding 10% of bond area |
Contact angle measurement | Surface energy change (contamination) | When bond repair is planned | Contact angle above 70 degrees indicates contamination |
Environmental exposure log | Cumulative moisture, UV, thermal cycles | Continuous tracking | Threshold based on adhesive qualification data |
Figure 2. Degradation Indicator Hierarchy
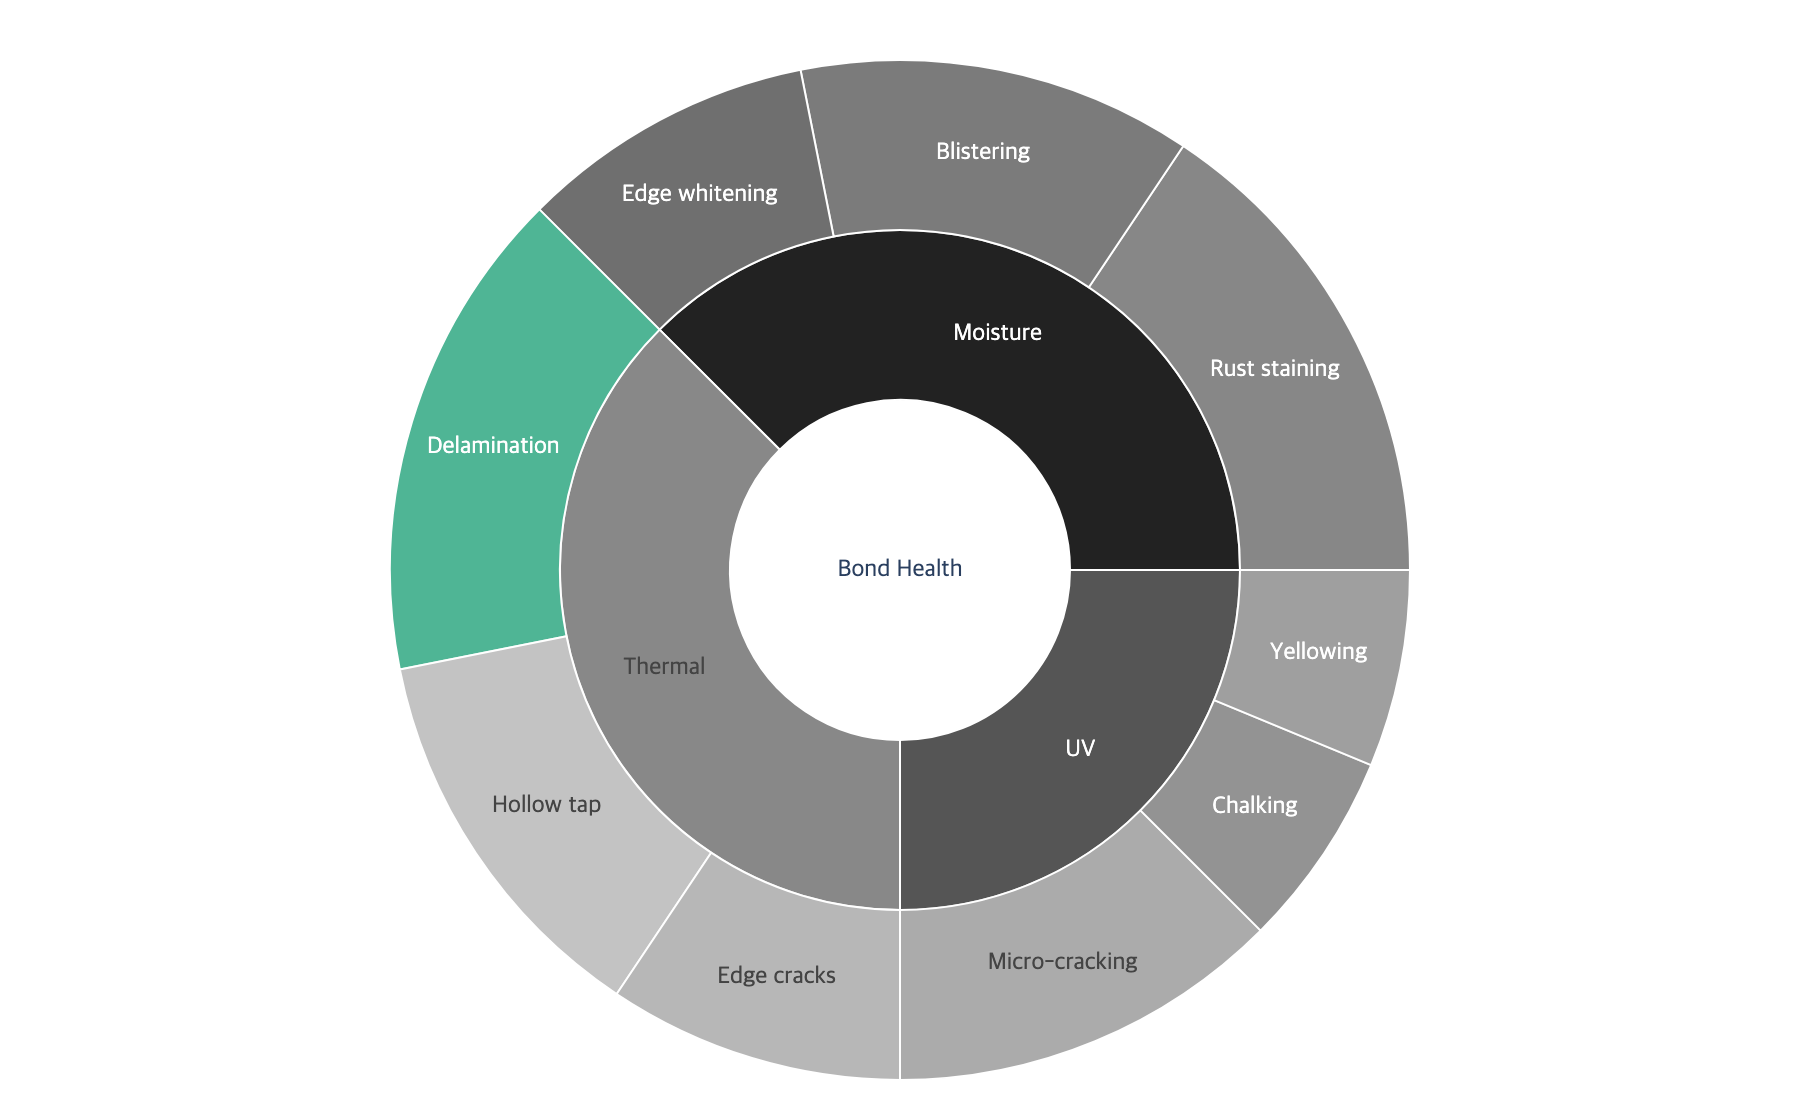
Figure 2b. Inspection Interval Recommendations by Exposure Severity
Environment | Visual Inspection | Tap Test | Ultrasonic | Exposure Log Review |
|---|---|---|---|---|
Indoor, controlled (20-25C, below 50% RH) | Annual | Every 2 years | Every 5 years | Annual |
Indoor, variable (temperature cycles, moderate humidity) | Semi-annual | Annual | Every 3 years | Semi-annual |
Outdoor, temperate | Quarterly | Semi-annual | Annual | Quarterly |
Outdoor, tropical (high humidity, UV) | Monthly | Quarterly | Semi-annual | Monthly |
Chemical process (chemical + thermal exposure) | Monthly | Monthly | Quarterly | Continuous |
The inspection frequency should increase when visual inspection reveals any changes, when environmental conditions exceed qualification limits, or when the bond approaches its design service life.
VI. NDT Methods for Bond Inspection: Capabilities and Limitations
No single NDT method can characterize all forms of bond degradation. Effective assessment requires combining methods.
Tap Testing (Manual and Instrumented)
Tap testing is the simplest bond inspection method. A well-bonded area produces a sharp "solid" sound; a disbonded area produces a "hollow" or "dull" sound. Manual tap testing detects disbonds larger than approximately 10 to 15 mm in thin-skinned structures (under 3 mm skin thickness), while instrumented devices improve detection to approximately 6 to 10 mm. Tap testing cannot detect kissing bonds and should be considered a screening tool; suspect areas require more sensitive evaluation.
Ultrasonic Testing
Pulse-echo ultrasonics transmit a pulse and analyze reflections; C-scan presentation maps entire bond areas visually. Through-transmission ultrasonics (TTU) requires two-sided access but is highly sensitive. Ultrasonic methods detect disbonds as small as 3 to 6 mm and can detect moisture accumulation in the bond line. The primary limitation is that conventional ultrasonics cannot reliably detect "kissing bonds" where surfaces are in contact but interfacial strength has degraded, one of the most significant challenges in bond inspection.
Thermographic and Shearographic Inspection
Active thermography (flash or lock-in methods) detects disbonds by analyzing thermal patterns after applying a heat stimulus. It is non-contact and can inspect large areas rapidly (up to several square meters per minute), detecting delaminations, moisture ingress, and adhesive thickness variations. Shearography, a laser-based interferometric technique, measures surface displacement gradients under applied stress (vacuum, thermal, or vibration loading) and is widely used in aerospace for rapid inspection of large bonded panels, covering one to two square meters per measurement. Both methods are limited in their ability to detect kissing bonds where surfaces remain in contact.
VII. Industry Patterns: Lessons from Aerospace, Automotive, and Marine
Each industry sector has encountered characteristic degradation patterns driven by its specific exposures.
Aerospace
The aerospace industry has the longest history with structural adhesive bonding. Bonded joints in aircraft experience thermal cycling spanning 60 to 80 degrees Celsius per flight cycle, varying humidity, and mechanical fatigue. The certification challenge for primary bonded structures has been recognized across 27 European countries, with main obstacles being bondline quality uncertainty and NDT limitations for detecting weak bonds and kissing bonds.
Surface preparation quality is the single strongest predictor of long-term bond durability. Bonds with proper phosphoric acid anodizing or sol-gel treatments retain 85 to 95 percent of strength after decades, while inadequate preparation can result in 50 percent or more loss within the first few years. Combined thermal-humidity conditioning produces the worst-case degradation, meaning inspection programs must account for combined exposure profiles.
Automotive
The vehicle body-in-white uses structural adhesives to bond steel and aluminum panels, creating thousands of joints per vehicle exposed to road-splash, temperature cycling, and vibration fatigue.
Galvanic corrosion at dissimilar metal joints is a primary failure driver. Modern automotive adhesive systems incorporate corrosion inhibitors and edge-sealing protocols to prevent electrolyte access.
Durability testing typically requires 1,000 to 3,000 thermal cycles (-40 to +80 degrees Celsius), 1,000 hours of salt spray (ASTM B117), and 500 hours of humidity exposure (ASTM D1151). Research shows polyurethane adhesives can retain up to 92 percent of lap-shear strength after combined aging, while some systems show stiffness losses of 51 percent and strength losses of 59 percent.
Marine
Marine environments represent the most aggressive exposure condition, with constant humidity above 85 percent RH, salt spray, UV radiation, and biological fouling creating a multi-mechanism degradation environment.
Marine experience has highlighted the importance of edge protection: bonds sealed at their perimeters with UV-resistant sealants consistently outperform exposed bonds by a factor of two to three in effective bond life.
VIII. Field-Practical Inspection Techniques
Several practical techniques provide useful bond health information with minimal equipment.
Visual Inspection and Tap Testing Protocols
Systematic visual inspection detects the majority of significant bond degradation. Examine bond line perimeters for whitening, discoloration, blistering, cracking, or separation. Check substrate material adjacent to the bond for corrosion products. Look for moisture pathways: condensation patterns, staining, or deposits indicating water flow toward the bond. Always compare against baseline photographs taken at installation.
For tap testing, use the same tapping instrument at consistent force and angle. Establish the "good bond" sound by tapping a known well-bonded area first, then systematically tap across the bond at approximately 10 to 15 mm intervals. Perform tap testing at consistent temperature, as thermal gradients can create false indications.
Moisture Detection and Temperature Monitoring
Commercially available moisture meters designed for building inspection can detect elevated moisture levels at bond line edges indicating active moisture ingress. A comparative reading between the bond area and a dry reference area provides actionable information even without absolute calibration.
Small battery-powered temperature loggers attached to representative bonded joints capture the actual thermal profile including cycle count, extremes, and heating rates. Place loggers at the most severe thermal locations: near heat sources, sun-exposed surfaces, and bonds that experience rapid temperature changes during process startup and shutdown.
Documentation and Trending
A single inspection provides a snapshot; a series of inspections over months or years reveals degradation rates and trajectories. Document the date, conditions, and findings for each bond. Photograph any changes. Maintain a database that allows comparison across inspection dates to identify bonds where degradation is accelerating.
IX. Key Takeaway
Adhesive bond degradation creates a hidden window of progressive strength loss before catastrophic failure; proactive monitoring detects degradation during this window
Moisture diffusion is the primary degradation mechanism: 2 percent moisture uptake can reduce Tg by 10 to 20 degrees Celsius and interfacial corrosion can reduce bond strength by 50 percent or more
UV-exposed bonds show chalking, yellowing, and micro-cracking at the surface that propagates into the bulk under mechanical loading; UV damage is cumulative and creates pathways for moisture ingress
Thermal cycling creates interfacial fatigue proportional to the CTE mismatch between bonded materials, concentrated at bond line edges; residual stresses from cure compound the problem
No single NDT method detects all degradation modes; effective monitoring combines tap testing for screening, ultrasonic methods for quantitative assessment, and thermography or shearography for rapid large-area inspection
Industry experience from aerospace, automotive, and marine sectors consistently shows that surface preparation quality and edge protection are the strongest predictors of long-term bond durability
Implement a tiered monitoring program combining visual inspection (frequent), tap testing (periodic), and ultrasonic C-scan (for critical structural bonds) with environmental exposure logging and documentation trending
The complexity of bond degradation monitoring points to an emerging need. Field engineers tracking dozens or hundreds of adhesive bonds across different environments, chemistries, and substrate combinations face an information management challenge that grows with every inspection cycle. Environmental exposure logs, inspection findings, and adhesive qualification data must be cross-referenced to estimate remaining bond life and prioritize resources. This is exactly the type of multi-variable, data-intensive problem where artificial intelligence changes the equation. Imagine a system that ingests your adhesive chemistry data, environmental exposure profiles, and inspection history, then calculates remaining bond life estimates, flags bonds approaching action thresholds, and adjusts inspection intervals automatically as conditions change. That capability is closer than you might think.
X. References
[1] PMC, "Strength in Adhesion: Multi-Mechanics Review", 2024. https://pmc.ncbi.nlm.nih.gov/articles/PMC12526568/
[2] MDPI Polymers, "Temperature, Humidity and Load Effects on Adhesive Joints", 2023. https://www.mdpi.com/2073-4360/15/2/339
[3] ResearchGate, "Creep and Aging of Adhesive Joints Under Static Loads", 2022. https://www.researchgate.net/publication/359007656
[4] ScienceDirect, "Structural Adhesive Creep Impact", 2024. https://www.sciencedirect.com/science/article/abs/pii/S0143974X24007284
[5] EPFL, "Fatigue of Structural Adhesive Joints", 2024. https://infoscience.epfl.ch/server/api/core/bitstreams/f0638bbf-773a-4403-8279-bb9c5120ae27/content
[6] ResearchGate, "Creep Behaviour of Epoxy Adhesives", 2024. https://www.researchgate.net/publication/390184380
[7] Wiley, "Fatigue Crack Growth in Acrylic Joints", 2023. https://onlinelibrary.wiley.com/doi/full/10.1111/ffe.13908
[8] ScienceDirect, "Cyclic Fatigue of PU Adhesive Joints", 2021. https://www.sciencedirect.com/science/article/pii/S2666330921000133
[9] ASTM, "Standard Guide for Adhesive Bond Inspection", 2024. https://www.astm.org/
[10] NASA, "Adhesive Bond Inspection and Repair Manual", 2023. https://www.nasa.gov/
[11] Henkel, "Structural Adhesive Durability Guide", 2024. https://www.henkel-adhesives.com/
[12] 3M, "Adhesive Bond Monitoring Best Practices", 2024. https://www.3m.com/
[13] ScienceDirect, "Environmental and Chemical Degradation of Carbon/Epoxy and Structural Adhesive: Fickian and Anomalous Diffusion, Arrhenius Kinetics", 2011. https://www.sciencedirect.com/science/article/abs/pii/S0263822311000845
[14] PMC, "Towards Reliable Adhesive Bonding: A Comprehensive Review of Mechanisms, Defects, and Design Considerations", 2024. https://pmc.ncbi.nlm.nih.gov/articles/PMC12195023/
[15] Springer, "Bonded Repair of Composite Structures in Aerospace: A Review on Environmental Issues", 2018. https://appliedadhesionscience.springeropen.com/articles/10.1186/s40563-018-0104-5
[16] MasterBond, "How to Manage Stresses Caused by CTE Mismatches". https://www.masterbond.com/techtips/how-manage-stresses-caused-cte-mismatches
[17] ASTM D1151, "Standard Practice for Effect of Moisture and Temperature on Adhesive Bonds". https://www.astm.org/d1151-00r13.html
Powered by Lubinpla
Discover how technical teams solve complex challenges faster with AI.