How Quote Turnaround Speed Bends Your Win-Rate Curve
요약
For chemical distributors and technical sales teams, the time between a customer's request and a delivered technical quote is not administrative overhead. It is a direct determinant of win rate. Research across more than 15,000 leads and 100,000 contact attempts found that responding within one hour made a firm roughly seven times more likely to qualify a prospect than waiting one additional hour, and about sixty times more likely than waiting 24 hours or longer (Lead Response Management Study, 2011). Yet the average business-to-business first response runs to 42 hours (Workato, 2024). This article quantifies how technical quote turnaround speed shapes win rate and revenue, decomposes where the hours actually go inside a typical quote cycle, and provides an operator-usable worksheet to dollarize the cost of slow quotes. It then identifies the specific steps in the cycle where workflow automation compresses elapsed time. The core finding is that a four-day quote does not lose on price. It loses by arriving after the buyer has already engaged a faster competitor.
Table of Contents
I. Introduction
II. The Quote-Speed and Win-Rate Relationship
III. Decomposing Quote Turnaround Time
IV. Dollarizing the Lost-Win Cost
V. Where Automation Compresses the Cycle
VI. Field Patterns
VII. Key Takeaway
VIII. References
I. Introduction
Technical quote turnaround speed is one of the strongest controllable predictors of win rate in technical distribution, and most teams are far slower than the buyer expects. The average business-to-business first response to an inbound request runs to about 42 hours (Workato, 2024), while a 2026 benchmark across 573 businesses found that 74 percent miss even a five-minute response window entirely (Blazeo, 2026, via Lead Response Time Statistics).
In specialty chemical sales, the quote is rarely a single price. It is a technical document that pairs a specification, a compatibility judgment, a safety data reference, and a commercial offer. That complexity is precisely why turnaround stretches into days, and why the win-rate cost of delay is easy to miss. The deal is not visibly lost. It simply never closes, because a competitor delivered a usable answer first.
This article treats quote turnaround as a measurable variable rather than a service nicety. It maps the published response-time research onto a win-rate curve, breaks the turnaround interval into its component steps, supplies a worksheet for converting slow quotes into a dollar figure, and shows where workflow automation removes elapsed time without removing the technical reviewer from the loop.
II. The Quote-Speed and Win-Rate Relationship
Faster technical quote turnaround raises win rate because the first credible responder captures the buyer before alternatives are evaluated. Research across more than 15,000 leads and over 100,000 contact attempts found that responding within one hour made a firm roughly seven times more likely to qualify a prospect than waiting one additional hour (Lead Response Management Study, 2011). The relationship is a steep decay curve, not a gentle slope.
How Steep Is the Decay in the First Hour?
The odds of converting a request collapse fastest at the very start of the interval. Contacting a prospect within five minutes rather than thirty minutes raised the odds of qualifying that prospect by about 21 times in the underlying data (Lead Response Management Study, 2011). Separately, the same body of research found that responding within one hour was roughly 60 times more likely to qualify a lead than waiting 24 hours or more (Harvard Business Review, 2011).
The mechanism is buyer attention. A request for a technical quote is usually issued to several suppliers at once, and the buyer is most engaged in the minutes and hours immediately after sending it. As the interval lengthens, competing quotes arrive, internal priorities shift, and the original urgency fades. By 24 hours, the practical effect on conversion is close to zero, because the buyer has typically already engaged whoever answered first.
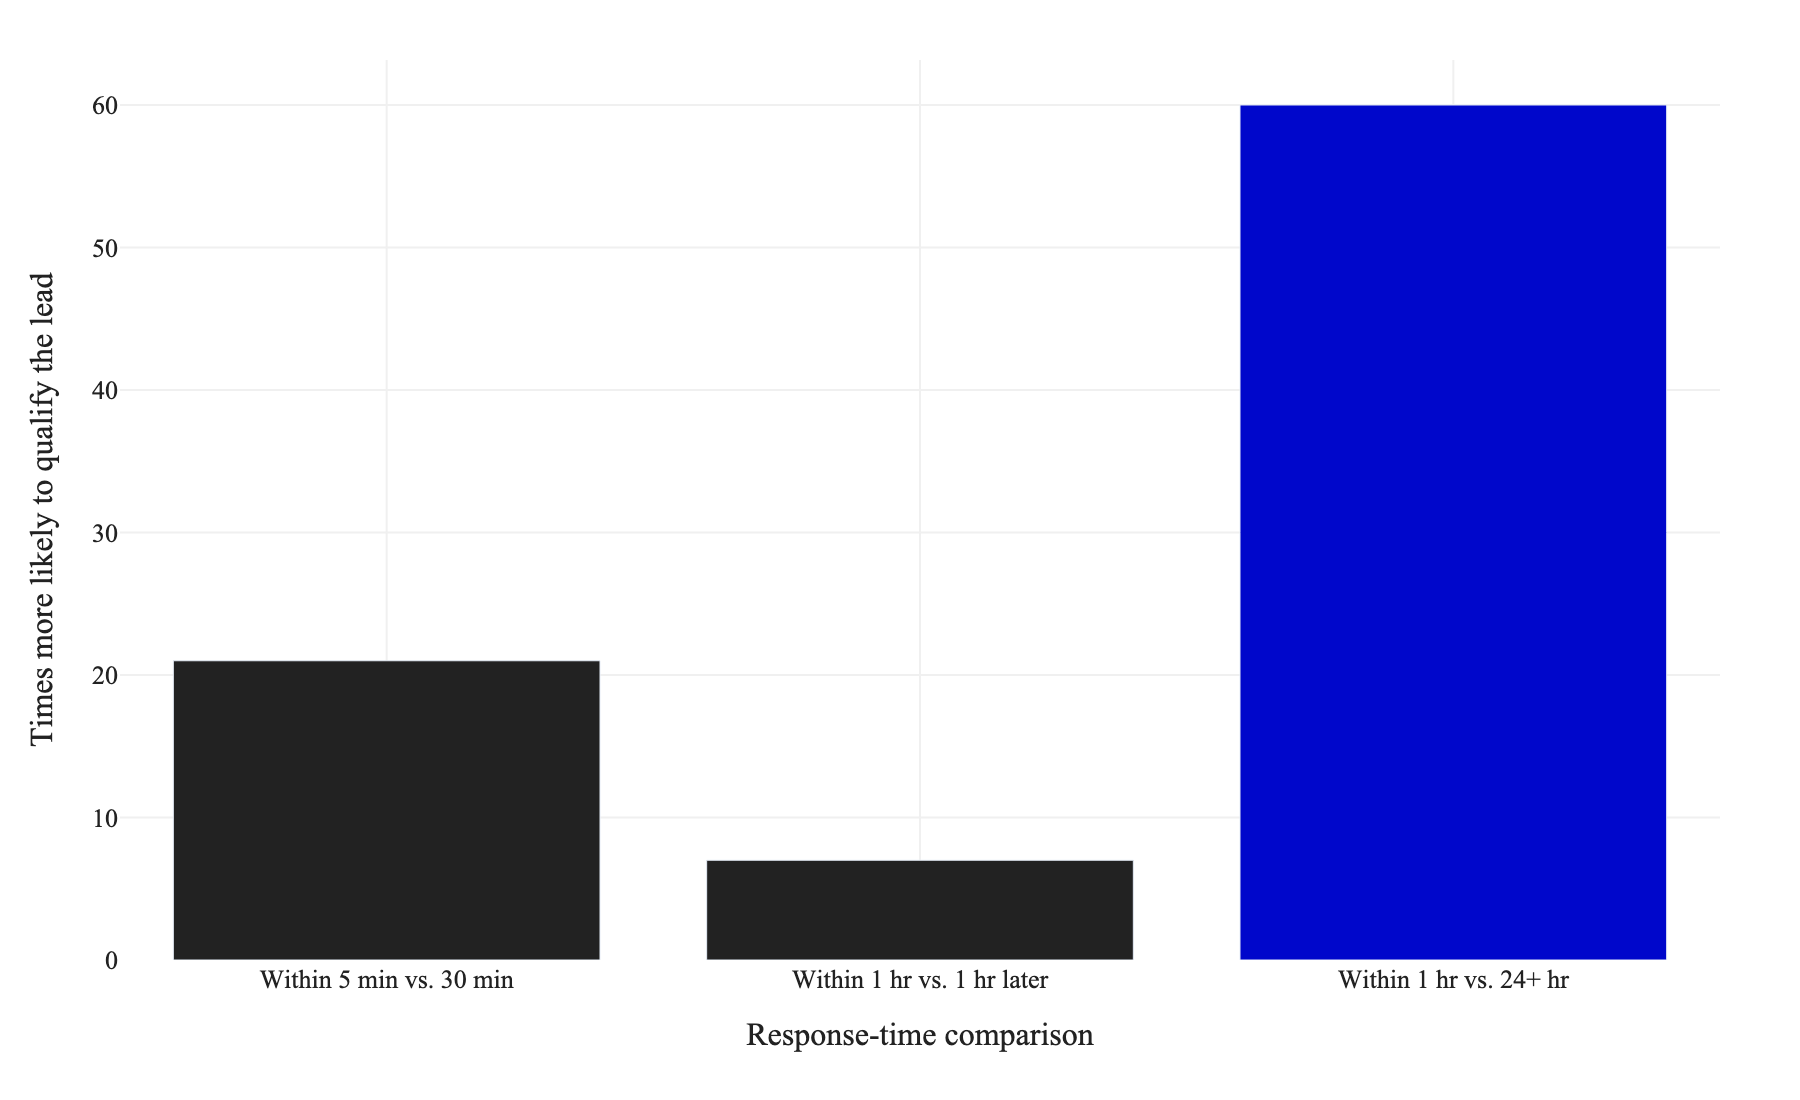
Figure 1. The Odds Decay Fastest in the First Hours: how many times more likely a faster response was to qualify an inbound lead, for three response-time comparisons. Sources: Lead Response Management Study (2011); Harvard Business Review (2011).
Who Wins When You Respond First?
The first credible responder captures a disproportionate share of the available business. A frequently cited figure holds that 78 percent of buyers purchase from the vendor that responds first (Lead Connect, via Workato, 2024), a number that best describes simpler, shorter-cycle decisions. For complex business-to-business sales, a more conservative estimate from a Google and Corporate Executive Board white paper places the first-responder advantage at 35 to 50 percent of deals (Google and CEB, via Lift AI).
Figure 2. Illustrative Win-Rate-by-Response-Time Decision Table
The table below is a planning aid. The directional shape, a steep early drop that flattens after the first day, follows the published research above. The exact win-rate percentages are illustrative model values for a complex technical sale and should be replaced with each team's own closed-won data before use.
Technical quote turnaround | Buyer state | Illustrative relative win rate |
|---|---|---|
Within 1 hour | Actively comparing, first quote in hand | Highest (index 100) |
1 hour to 1 business day | Still evaluating, some quotes arriving | Moderate (index 55 to 70) |
1 to 3 business days | Likely already favoring a faster supplier | Low (index 25 to 40) |
4 or more business days | Decision often already made elsewhere | Lowest (index under 20) |
The index values above are assumptions, not measured outcomes. They exist so a team can frame its own data in the same structure. The defensible, sourced claim is the ordering and the steepness: the largest single loss of win probability happens between the first hour and the first day, which is exactly the window most technical quote cycles overshoot.
III. Decomposing Quote Turnaround Time
Most technical quote turnaround time is consumed by waiting and rework, not by the technical judgment itself. A manual quote in distribution commonly takes five to nine business days in the best case and can involve roughly three hours of direct manual work per request, with inside sales teams spending a large share of their time quoting rather than selling (ChannelFlex, 2025). Understanding where the hours accumulate is the prerequisite to compressing them.
Which Steps Actually Consume the Hours?
The elapsed time in a technical quote is dominated by handoffs and queues rather than active work. A request typically passes from a sales inbox to a technical reviewer, to a pricing or sourcing check, and back, with each handoff introducing a wait. The active technical reasoning, confirming product suitability and pulling the right specification, is often a small fraction of total elapsed time.
The table below separates the interval into active work and waiting. Active work is irreducible technical judgment. Waiting is the compressible portion, and it is usually the majority of the cycle.
Figure 3. Quote Turnaround Decomposition (Illustrative Manual Cycle)
Cycle stage | Type | Illustrative share of elapsed time |
|---|---|---|
Intake, logging, and clarification | Waiting and rework | 20 to 30 percent |
Technical review and product matching | Active work | 10 to 20 percent |
Pricing, sourcing, and approval handoffs | Waiting | 30 to 40 percent |
Document assembly and formatting | Waiting and rework | 15 to 25 percent |
The percentage shares above are illustrative and labeled as assumptions, not measured values. The sourced underlying fact is that a manual distribution quote runs five to nine business days best case while the direct manual work is on the order of hours (ChannelFlex, 2025), which means the large majority of elapsed time is queue and handoff rather than active reasoning. That gap between hours of work and days of elapsed time is the target for compression.
IV. Dollarizing the Lost-Win Cost
The revenue forfeited to slow technical quote turnaround can be calculated directly from quote volume, average deal value, and the win-rate gap between fast and slow response. This section provides a worksheet so a team can produce its own figure rather than rely on a generic claim. The methodology is deliberately conservative and uses only inputs a sales operation already tracks.
How Do You Convert Slow Quotes Into a Dollar Figure?
The forfeited-revenue estimate is the product of four numbers a team already has: monthly quote volume, average won-deal value, gross margin, and the difference in win rate between fast and slow turnaround. Multiply quote volume by the win-rate gap to get incremental deals, then by deal value and margin to get recovered gross profit.
Figure 4. Quote-Turnaround Lost-Win Cost Worksheet
Fill the worksheet with your own figures. Every input is a value a sales operation already tracks, except the win-rate gap, which should come from your own closed-won analysis. If you lack that analysis, treat the gap as the single assumption to validate first.
Line | Input or formula | Example value |
|---|---|---|
A. Technical quotes issued per month | Your CRM or quoting log | 200 quotes |
B. Average won-deal value | Closed-won average | USD 8,000 |
C. Win rate at slow turnaround | Closed-won at current speed | 18 percent |
D. Win rate at fast turnaround | Target or benchmarked speed | 28 percent |
The second half of the worksheet turns those four inputs into a monthly and annual figure. Carry the values from the table above into the formula below.
Line | Calculation | Example result |
|---|---|---|
E. Win-rate gap (D minus C) | Percentage points recovered | 10 points |
F. Incremental wins per month (A times E) | Additional closed deals | 20 deals |
G. Incremental revenue per month (F times B) | Monthly revenue recovered | USD 160,000 |
H. Annualized (G times 12) | Yearly revenue recovered | USD 1,920,000 |
The example numbers are illustrative inputs chosen to show the arithmetic, not a claim about any specific company. The honest input is line E, the win-rate gap, which must come from a team's own data. The published research supports the direction and steepness of that gap rather than a universal magnitude, so the worksheet deliberately leaves the gap as the user's own measured value. Even a conservative gap of a few percentage points, multiplied across a full year of quote volume, typically produces a six- or seven-figure annual number, which is the point of running the calculation.
V. Where Automation Compresses the Cycle
Workflow automation compresses technical quote turnaround by removing the waiting and rework stages identified in Section III, while keeping the technical reviewer in control of the judgment. The target is not to remove the human from a technical decision. It is to eliminate the queues, re-keying, and document assembly that sit on either side of that decision. Automation in RFQ-heavy operations is consistently framed as reducing turnaround from days toward hours by attacking exactly these handoffs (Arphie, 2025).
Which Stages Are Safe to Automate First?
The compressible stages are intake, retrieval, and document assembly, because none of them is the technical judgment itself. Automated intake parses an incoming request and structures it without a manual logging step. Automated retrieval surfaces the matching product, specification, and safety data reference so the reviewer is not searching across systems. Automated assembly drafts the quote document in the house format once the reviewer confirms the technical content.
This is where Lubinpla's AI Crew fits naturally. AI Crew is a subscription platform of specialized agents that automate technical-sales, customer-support, and operations workflows for specialty chemical companies. In the quote cycle, that means an agent can handle intake structuring, knowledge retrieval, and first-draft document assembly continuously, so a technical reviewer spends time on the suitability judgment rather than on logging, searching, and formatting. The reviewer still owns the answer. The agent removes the wait around it.
What Stays With the Human?
The active technical review stays with the human, because product suitability in specialty chemicals depends on application context that should not be auto-approved. Automation should present the reviewer with a structured request and a candidate answer, then stop. The reviewer confirms or corrects, and only then does the document proceed. This preserves accuracy while still removing the majority of elapsed time, which Section III showed is concentrated in the non-judgment stages.
Figure 5. Automation Target by Cycle Stage
Cycle stage | Compressible by automation? | What automation does |
|---|---|---|
Intake and clarification | Yes | Parse and structure the request |
Technical review and matching | Partly | Surface candidates, human confirms |
Pricing and approval handoffs | Partly | Route and pre-fill, human approves |
Document assembly | Yes | Draft the quote in house format |
The table reinforces a single principle. The stages marked fully compressible are the waiting and rework stages, and they are where elapsed time concentrates. The stages marked partial keep a human approval gate. Compressing the first group while protecting the second is how turnaround drops from days toward hours without trading away technical correctness.
VI. Field Patterns
Across technical distribution, the recurring pattern is that slow quotes lose silently, fast intake is the highest-leverage fix, and the win-rate gap is invisible until someone measures it. These are aggregate patterns rather than a single attributed case, consistent with the published response-time research and with how manual quoting consumes elapsed time.
Pattern One: The Loss Is Invisible Because the Deal Never Appears Lost
The most common pattern is that slow quotes do not register as losses. A quote sent on day five against a competitor's day-one quote rarely produces a rejection notice. The buyer simply proceeds with the faster supplier, and the slow supplier records the request as unconverted rather than lost-on-speed. Because 78 percent of buyers in simpler decisions favor the first responder (Lead Connect, via Workato, 2024), a team can forfeit a large share of winnable business while believing its win rate reflects price or product fit.
Pattern Two: Intake Speed Moves the Curve More Than Price Concessions
A second recurring pattern is that compressing the intake and first-response stage shifts win rate more than discounting does, because the steepest part of the decay curve is the first hour (Lead Response Management Study, 2011). Teams that discount to win are often paying margin to solve a problem that was actually a turnaround problem. Answering faster captures the same deal at full margin, which is why the lost-win worksheet in Section IV uses gross profit rather than revenue alone.
Pattern Three: The Gap Stays Hidden Until Win Rate Is Segmented by Speed
The third pattern is that the win-rate gap only becomes visible when closed-won data is segmented by technical quote turnaround time. Teams that do not segment see a single blended win rate and conclude their process is acceptable. Teams that segment by response interval consistently find the steep early decay the research predicts, which is the trigger for prioritizing the intake and assembly stages that Section V identifies as compressible.
VII. Key Takeaway
Technical quote turnaround speed is a measurable win-rate driver, and the decay is steepest in the first hour: responding within one hour was roughly seven times more likely to qualify a prospect than waiting one more hour, and about 60 times more likely than waiting 24 hours (Lead Response Management Study, 2011; Harvard Business Review, 2011).
The first credible responder captures a disproportionate share of deals, estimated at 35 to 50 percent for complex sales and as high as 78 percent for simpler decisions (Google and CEB, via Lift AI; Lead Connect, via Workato, 2024). Most teams forfeit this advantage with an average 42-hour first response (Workato, 2024).
Most turnaround time is waiting and rework, not technical judgment. A manual distribution quote runs five to nine business days best case while direct work is only hours (ChannelFlex, 2025), so the majority of elapsed time is compressible queue and handoff.
Use the lost-win worksheet in Section IV to convert your own quote volume and win-rate gap into an annual dollar figure. The single input to validate first is the win-rate gap between fast and slow turnaround, drawn from your own closed-won data.
Automate the intake, retrieval, and document-assembly stages while keeping the technical reviewer as the approval gate. This is the configuration that drops turnaround from days toward hours without trading away technical correctness.
Calculate the AI Crew ROI for your team's quoting workload by running your own quote volume and win-rate gap through the worksheet in Section IV. To see how AI Crew compresses the intake-to-quote cycle in your environment, review the AI Crew workflow walkthrough on the Lubinpla site at https://www.lubinpla.com.
VIII. References
[1] Blazeo (via Casey Response), "Lead Response Time Statistics (2026): The 5-Minute Rule", 2026. https://caseyresponse.com/blog/lead-response-time-statistics
[2] ChannelFlex, "Why Your Distributor Quoting Process Is Costing You Deals", 2025. https://channelflex.com/blog/why-your-quoting-process-is-costing-you-deals/
[3] Lift AI, "50% Of Sales Go To The First Company to Respond. Here's How to Beat Them All", 2024. https://www.lift-ai.com/blog/50-percent-of-sales-go-to-the-first-company-to-respond-heres-how-to-beat-them-all
[4] Oldroyd, J., McElheran, K., and Elkington, D., "The Short Life of Online Sales Leads", Harvard Business Review, 2011. https://hbr.org/2011/03/the-short-life-of-online-sales-leads
[5] Lead Response Management Study (with Professor Oldroyd, data from InsideSales.com), "Lead Response Management Study", 2011. https://www.leadresponsemanagement.org/lrm_study/
[6] Arphie, "What is RFQ Software: The Data Behind Why Manual Quoting Is Killing Win Rates", 2025. https://www.arphie.ai/glossary/rfq-automation
[7] Workato, "B2B Lead Response Times: What We Learned from 114 Companies", 2024. https://www.workato.com/the-connector/lead-response-time-study/
Powered by Lubinpla
Discover how technical teams close more quotes, faster, with AI.

