How Wrong Product Choices Cost Industrial Teams 3x More Than the Product Itself
Summary: A wrong product selection in industrial chemistry rarely ends at the purchase price. When an incompatible lubricant, corrosion inhibitor, or cleaning agent enters a production system, it triggers a cascade of costs, from equipment damage and unplanned downtime to labor-intensive troubleshooting and remediation. This article quantifies the true total cost of common product selection errors using a structured cost model, demonstrating that the downstream impact typically exceeds the product cost by a factor of three or more. By understanding where these hidden costs accumulate, technical teams can build a stronger business case for investing in mechanism-based product selection.
Table of Contents
I. The Price Tag You Do Not See
II. Why Wrong Products Create Cascading Costs
III. The Chemistry of Incompatibility
IV. A Total Cost Model for Common Selection Errors
V. Three Selection Error Scenarios Quantified
VI. How Mechanism-Based Selection Prevents Cost Escalation
VII. Key Takeaway
VIII. References
I. The Price Tag You Do Not See
Unplanned downtime in chemical and process industries costs an estimated USD 20 billion annually in the United States alone, with average losses reaching USD 260,000 per hour for a typical manufacturing facility (Siemens, 2024). Globally, the world's 500 largest companies lose USD 1.4 trillion each year to unplanned stoppages, equivalent to 11 percent of their total revenues. A significant portion of this downtime traces back to incorrect product selection. When emergency repairs, lost production, quality rework, and remediation labor are combined, the true cost of a wrong product choice routinely exceeds the product cost by a factor of three to five.
The Purchase Price Illusion
The fundamental problem is that purchase price is visible and immediate, while downstream costs are distributed across maintenance budgets, quality departments, and production loss reports. A corrosion inhibitor that costs 15 percent less per kilogram may seem like a savings decision. However, if that inhibitor is chemically incompatible with the system metallurgy, the resulting corrosion damage can generate repair costs that dwarf the original savings within months.
This pattern repeats across every product category. The purchase order captures only one number: unit price. Everything that follows, the equipment wear, the unplanned shutdown, the weekend overtime for the maintenance crew, lands in separate budget lines where the connection to the original selection decision becomes invisible.
Why Procurement Metrics Reinforce the Problem
In many organizations, procurement teams are measured on cost reduction percentages. A switch to a lower-cost chemical that saves USD 8,000 per year gets recorded as a procurement win. When that same switch causes a USD 192,000 production loss six months later, the cost appears as an operations expense, not a procurement outcome. The person making the decision never sees the full cost of getting it wrong. The average plant experiences roughly 800 hours of lost production annually (Siemens, 2024), and 98 percent of organizations report that even a single hour of downtime costs over USD 100,000.
II. Why Wrong Products Create Cascading Costs
Product selection errors do not produce isolated failures. A wrong chemical product interacts with materials, operating conditions, and other chemicals in the system, creating a chain reaction of degradation that compounds over time.
The Four Cost Layers
Costs accumulate in four distinct layers. Layer 1, direct product cost, is the purchase price, the only cost visible at the time of selection and consistently the smallest component. Layer 2, equipment damage, encompasses accelerated wear, corrosion, or contamination from chemical incompatibility. By the time visible damage appears, degradation has typically been progressing for weeks or months, and emergency repairs cost three to five times more than planned maintenance (NIST, 2023). Layer 3, downtime and production loss, is almost always the largest cost component. For mid-size manufacturers, two-thirds of companies experience unplanned downtime at least once a month, at USD 125,000 per hour; in heavy industry, the figure can reach USD 2.3 million per hour (Siemens, 2024). Layer 4, labor and remediation, includes troubleshooting, system decontamination, replacement product procurement, root cause analysis, and incident reporting.
Each layer is typically larger than the previous one.
The Time Factor
Product selection errors compound because degradation is gradual. A slightly wrong lubricant grade generates a subtle increase in friction and operating temperature that accelerates wear over weeks. By the time the failure manifests as a bearing seizure, the damage extends to shafts, seals, and adjacent components. Research consistently shows that approximately 80 percent of bearing failures are caused by improper lubrication, including use of the wrong lubricant type, insufficient quantity, or excessive temperatures that degrade the lubricant (Bearing News, 2020). Facilities relying on reactive maintenance experience 3.3 times more downtime and 16 times more defects than those using preventive approaches (UpKeep, 2024).
The gradual nature of degradation also means the root cause is often misidentified. A maintenance team may replace a failed bearing without questioning the lubricant, only to see the same failure repeat. It is not uncommon for a selection error to cause three or four repeat failures before the true root cause is identified.
The Ripple Effect Across Systems
A product selection error in one part of a plant can propagate to other systems. Dissolved copper from corroding heat exchanger tubes circulates through an entire cooling loop, depositing on steel surfaces and creating galvanic corrosion cells far from the original failure point. A wrong cleaning chemical that leaves residues contaminates downstream processes across multiple production lines. The interconnected nature of industrial systems means a single selection error can generate costs in locations that seem unrelated to the original decision.
III. The Chemistry of Incompatibility
Three chemical mechanisms account for the majority of incompatibility-driven failures in industrial chemistry.
Three Primary Failure Mechanisms
Additive interference occurs when chemical additives react with system materials or other chemicals, neutralizing protective functions. Certain anti-wear additives that perform well with steel-on-steel contact can become aggressive toward copper alloys, zinc coatings, or elastomeric seals. This is not a product defect; it is a mismatch between product chemistry and system materials that a specification sheet alone cannot reveal.
pH disruption happens when a chemical shifts system pH outside the optimal range for material protection. A shift of just 0.5 pH units can double corrosion rates on mild steel. For aluminum, the protective oxide film is only stable between approximately pH 4.5 and 8.5 (NIST Materials Data). Above pH 8.5, aluminum hydroxide becomes soluble and the metal loses its natural corrosion barrier. A cleaning product that works on steel at pH 10 can cause rapid surface etching on aluminum, and if both metals are present in the same system, no single pH value may be optimal.
Thermal degradation acceleration occurs when products break down at actual operating temperatures faster than expected, generating acidic byproducts that attack system materials. A lubricant rated for 80 degrees C may perform adequately in lab tests, but in a real system where localized hot spots reach 95 or 100 degrees C, degradation accelerates exponentially. The byproducts can block passages, coat heat transfer surfaces, and corrode components even when bulk fluid temperature appears acceptable.
Why Specification Matching Fails
Two products with identical specifications can perform very differently in the same system. Data sheets report standardized test results (viscosity, flash point, pour point, total acid number) that are necessary but do not capture the information that determines compatibility in a real system.
Data sheets do not report additive chemistry composition: two hydraulic fluids can meet the same ISO viscosity grade while using completely different additive packages with divergent material compatibility profiles. Data sheets do not capture system material interactions: an inhibitor tested on mild steel coupons may perform well in the lab but accelerate copper dissolution in a mixed-metallurgy field system. And data sheets do not account for combined effects: in real systems, lubricants contact seal materials, cooling water treatments interact with biocides, and cleaning residues mix with process fluids. These multi-variable interactions cannot be predicted from individual product specifications. Mechanism-based selection addresses this gap by evaluating the underlying chemical interactions between product, substrate, and operating environment as a system.
IV. A Total Cost Model for Common Selection Errors
To quantify the true cost of wrong product selection, a structured total cost model breaks the impact into measurable components. This model applies across product categories and provides a framework for evaluating any selection decision beyond purchase price.
The 1x-3x-5x Cost Structure
Analysis of industrial failure data reveals a consistent cost structure across different product categories and industries. Equipment damage costs 1.5x to 3x the product cost. Downtime loss adds 2x to 5x. Labor and remediation contribute 1x to 2x. Total cost ranges from 5.5x to 11x the original product cost.
The range depends on the hourly production value of the affected line. A selection error on a utility system at a small facility may generate a 5x to 6x multiple. The same error on a critical process line at a high-value plant can reach 10x or higher. The U.S. Department of Energy has documented that predictive maintenance programs deliver a tenfold ROI and a 35 to 45 percent reduction in downtime, establishing that prevention costs a fraction of consequences.
Figure 1. Total Cost Breakdown of a Typical Product Selection Error
Cost Category | Cost Multiple (vs. Product Cost) | Example: USD 5,000 Product |
|---|---|---|
Direct product cost | 1.0x | USD 5,000 |
Equipment damage and repair | 2.0x | USD 10,000 |
Downtime and production loss | 3.0x | USD 15,000 |
Labor and remediation | 1.5x | USD 7,500 |
Total | 7.5x | USD 37,500 |
In this mid-range scenario, the product itself accounts for only 13 percent of total impact. Emergency repairs cost three to five times more than planned maintenance, and each dollar invested in preventive maintenance saves five dollars downstream (NIST, 2023). Research from Jones Lang LaSalle has found that preventive maintenance programs deliver a return on investment exceeding 545 percent.
Figure 2. Cost Waterfall of a Typical Product Selection Error
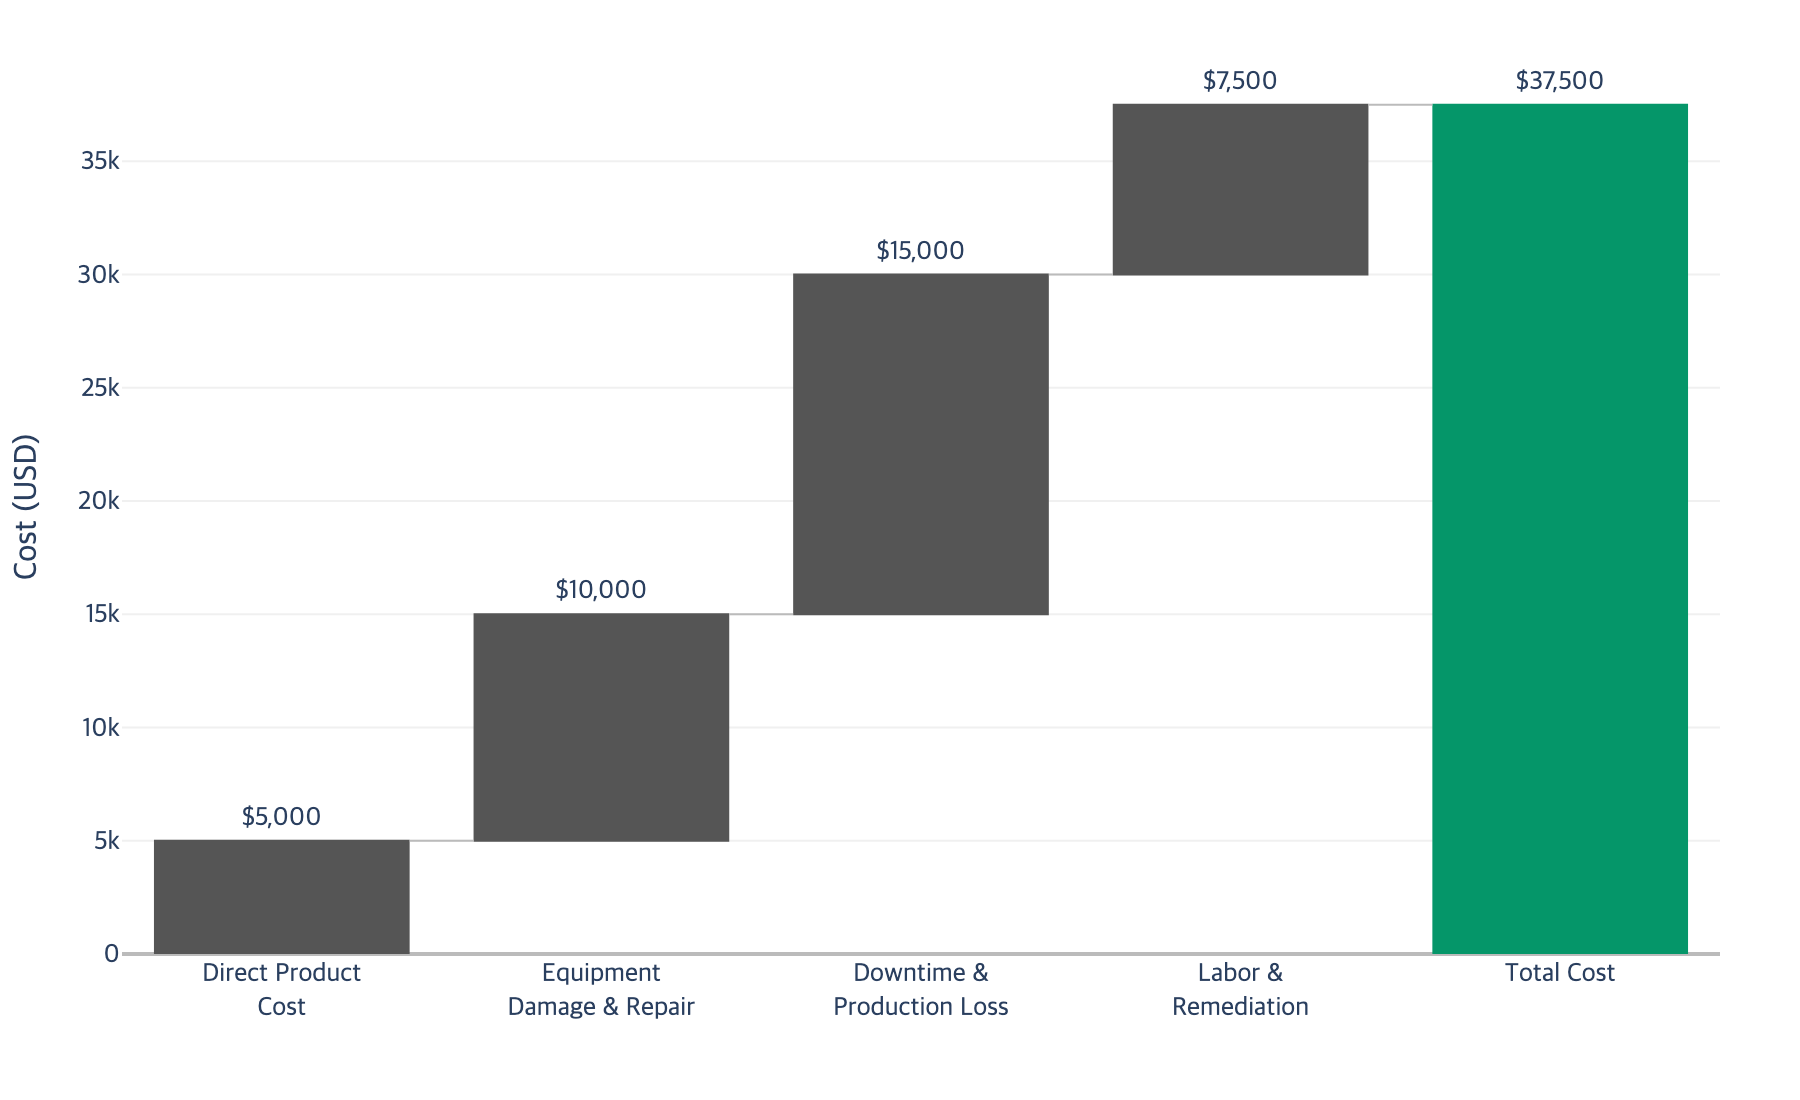
The waterfall chart illustrates how costs accumulate through each layer, with the direct product cost representing the smallest contribution and each subsequent layer adding progressively larger increments to reach 7.5 times the original expenditure.
Why the Model Understates True Cost
The 7.5x model captures direct, quantifiable costs. It does not include several real but harder-to-measure impacts: opportunity cost (lost production capacity that cannot be recovered when a plant runs near capacity), quality cost (defective product manufactured between degradation onset and failure detection), organizational cost (management time, incident investigation, and process revalidation in regulated industries), and relationship cost (customer impact from delayed deliveries or quality escapes that can trigger penalty clauses in automotive and aerospace supply chains).
When these factors are included, the true total cost of a product selection error is conservatively 10x to 15x the original product cost.
V. Three Selection Error Scenarios Quantified
The following scenarios illustrate how the total cost model applies across three major industrial chemistry categories, using anonymized but structurally representative field data.
Scenario 1: Wrong Lubricant Grade in Hydraulic System
Company A switched from a zinc-based anti-wear hydraulic fluid to a lower-cost ashless alternative without verifying compatibility with the system's bronze valve components. The system operates at 70 degrees C and 280 bar. Within four months, accelerated wear on valve spools caused internal leakage to increase by 40 percent, requiring full valve replacement.
The failure mechanism is well established in tribology literature. Zinc dithiophosphate (ZDDP) additives form a protective tribofilm on metal surfaces under boundary lubrication conditions, particularly effective at protecting soft metals like bronze against harder steel counterfaces. The ashless alternative relied on phosphate esters that provide adequate steel-on-steel protection but form a less effective boundary film on bronze. Under 280 bar operating pressure, the bronze valve spools experienced metal-to-metal contact that the new fluid could not prevent. This is consistent with industry data showing that approximately 80 percent of bearing failures trace to lubrication issues (Bearing News, 2020).
Cost Component | Amount (USD) |
|---|---|
Annual lubricant cost savings (attempted) | 3,200 |
Valve spool replacement (2 units) | 8,400 |
System flush and fluid replacement | 2,800 |
Production loss (18 hours at USD 4,500/hr) | 81,000 |
Troubleshooting labor (3 technicians, 24 hrs) | 5,400 |
Total cost of selection error | 97,600 |
Cost multiple vs. attempted savings | 30.5x |
The root cause was additive chemistry incompatibility. If the selection process had evaluated additive mechanism compatibility with the system's specific metallurgy rather than only comparing viscosity grade and general anti-wear specifications, this failure would have been prevented.
Scenario 2: Incompatible Corrosion Inhibitor in Cooling Water
Company B replaced a molybdate-based corrosion inhibitor with a lower-cost phosphonate program in a cooling system with mixed metallurgy (mild steel piping and copper alloy tube bundles). Over six months, copper corrosion rates tripled, and dissolved copper redeposited on steel surfaces, creating galvanic corrosion cells.
Molybdate-based inhibitors form a passive film on both ferrous and non-ferrous metals, providing balanced protection in mixed-metallurgy systems. Phosphonate programs are effective steel corrosion inhibitors but do not provide the same copper-alloy protection. As Veolia's water treatment handbook notes, the corrosion control program must be tailored to the system metallurgy since some inhibitors are more effective for particular metals than others. In Company B's system, copper corrosion rates in the tube bundles increased from 0.1 mpy to over 0.3 mpy. The dissolved copper circulated through the system and deposited on steel surfaces through galvanic displacement, creating localized corrosion cells that penetrated pipe walls far from the original failure point.
Cost Component | Amount (USD) |
|---|---|
Annual chemical cost savings (attempted) | 8,500 |
Heat exchanger tube bundle replacement | 22,000 |
Steel pipe section repairs | 14,000 |
Emergency treatment conversion | 6,500 |
Production loss (32 hours at USD 6,000/hr) | 192,000 |
Total cost of selection error | 239,000 |
Cost multiple vs. attempted savings | 28.1x |
An effective cooling water treatment program always begins with a full audit of system metallurgy, equipment design, and materials of construction before selecting an inhibitor chemistry.
Scenario 3: Wrong Cleaning Chemistry for Precision Components
Company C switched from a pH-neutral cleaner for non-ferrous metals to a mildly alkaline general-purpose cleaner (pH 9.5) for aluminum components. Over three months, surface etching increased coating adhesion failures from 2 percent to 12 percent, triggering quality complaints from downstream customers.
Aluminum's protective oxide layer is stable in a pH window of approximately 4.5 to 8.5 (NIST Materials Data). At pH 9.5, the alkaline cleaner dissolved the oxide layer, creating micro-roughening that was subtle enough to pass visual inspection but sufficient to disrupt subsequent coating uniformity. The failure rate increased from 2 percent to 12 percent over three months. Because the cleaning process had not been flagged as a variable, the quality team initially investigated coating application parameters and raw material variations before tracing the issue back to the chemistry change, adding weeks of defective production before the root cause was identified.
Cost Component | Amount (USD) |
|---|---|
Annual cleaning chemical savings (attempted) | 4,200 |
Rework costs (strip and recoat, 850 parts) | 34,000 |
Customer quality claims | 8,000 |
Process revalidation | 6,500 |
Production slowdown (5-day quality hold) | 45,000 |
Total cost of selection error | 96,700 |
Cost multiple vs. attempted savings | 23.0x |
The risk of using an alkaline process on aluminum is well documented: alkaline salts left behind after inadequate rinsing create corrosion initiation sites that further compromise coating performance over time.
Figure 3. Attempted Savings vs. Actual Cost Across Three Scenarios
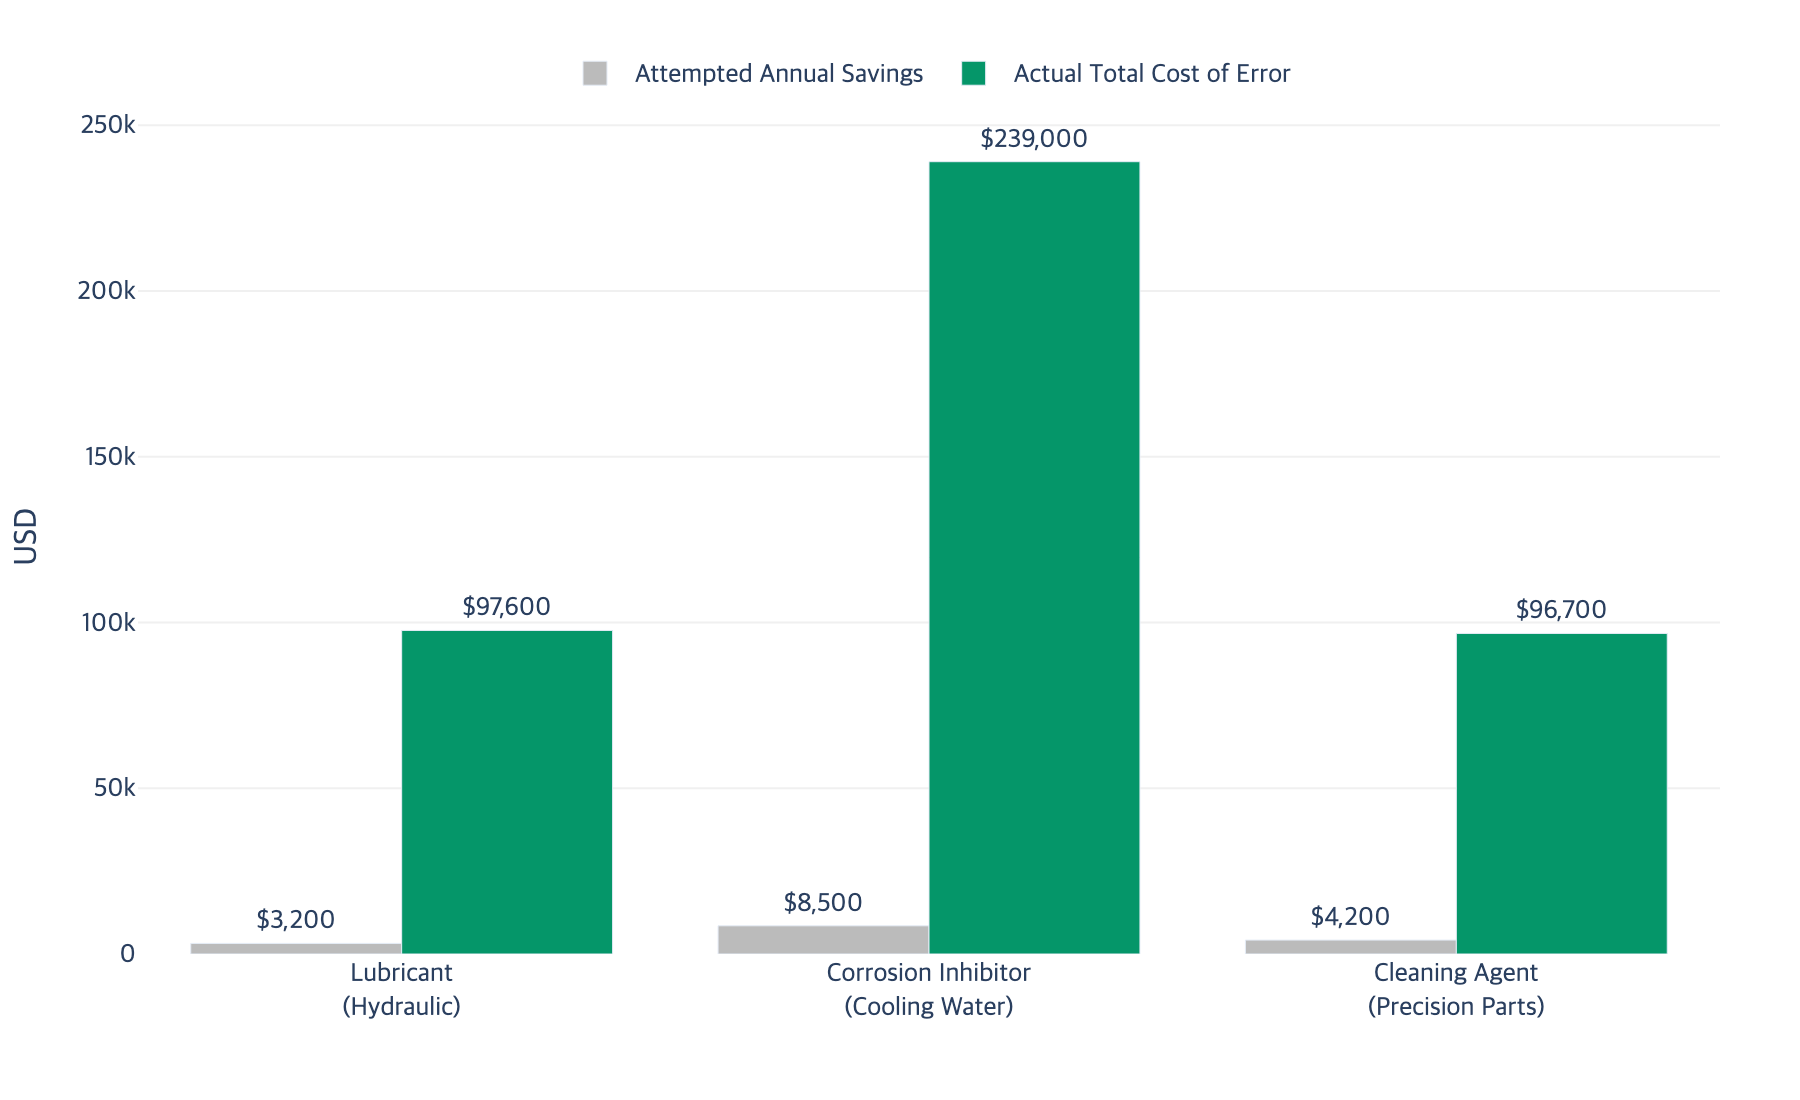
Across all three scenarios, actual cost exceeded attempted savings by 23x to 30x. The cooling water case produced the largest absolute cost due to extended downtime at a high hourly production value, but the pattern is consistent across product categories: selection errors generate disproportionate downstream costs regardless of chemistry type.
Common Threads Across All Three Scenarios
Several patterns recur across these cases. Every selection decision was driven by unit cost comparison based on specifications that did not capture the relevant compatibility dimensions. Every failure involved a time delay of three to six months between product introduction and visible consequences, during which costs accumulated invisibly. None of the three organizations had a pre-purchase evaluation process that would have flagged the incompatibility, even though the information needed to predict each failure existed in the chemistry of the products and materials involved. And in every case, the production loss component dominated total cost, underscoring why downtime avoidance should be the primary driver of product selection decisions.
VI. How Mechanism-Based Selection Prevents Cost Escalation
Each scenario above treated product selection as a procurement task when it is fundamentally an engineering decision.
The Three-Dimensional Selection Framework
Effective product selection evaluates three dimensions simultaneously.
Chemical compatibility asks whether the product chemistry interacts safely with all system materials, including seals, gaskets, and coatings, not just the primary contact surface. It also considers additive stability under actual system conditions, not just laboratory test conditions.
Condition matching asks whether the product performs under actual operating temperature, pressure, and contamination levels. Laboratory data obtained under controlled conditions often diverges from field performance where temperatures fluctuate and multiple stress factors act simultaneously.
System integration asks whether the product maintains its function alongside other chemicals in the system. The combined behavior of lubricants with seal materials, water treatments with biocides, and cleaning residues with process fluids determines whether the system performs as designed or degrades.
When all three dimensions are evaluated before purchase, cascading cost scenarios become preventable rather than inevitable.
The Cost of Getting It Right vs. Getting It Wrong
The U.S. Department of Energy documents that preventive programs reduce breakdowns by 70 to 75 percent and cut maintenance costs by 25 to 30 percent. A thorough compatibility assessment might require 8 to 16 hours of technical evaluation. Compare that to the 18 to 32 hours of unplanned downtime documented in the scenarios above, multiplied by hourly production values of USD 4,500 to USD 6,000. The engineering time invested in upstream analysis is a fraction of the cost of dealing with a selection error after it manifests.
Moving From Reactive to Predictive Selection
The traditional product selection process is inherently reactive: select a product based on data sheets and vendor recommendations, introduce it into the system, and monitor for problems. When problems appear, investigate. This cycle can repeat multiple times before the right product is identified.
A mechanism-based approach inverts this sequence. Instead of waiting for failures to reveal incompatibilities, the selection process identifies potential failure mechanisms before the product enters the system. Lubinpla's platform performs this multi-dimensional analysis by cross-referencing product chemistry against substrate materials and operating conditions, identifying incompatibilities before they enter the system. This shifts the selection process from a cost-driven procurement decision to a risk-informed engineering decision, where the total cost perspective is built into the workflow rather than reconstructed after a failure.
VII. Key Takeaway
Purchase price represents only 10 to 15 percent of total cost when a selection error occurs, with downstream costs typically exceeding product cost by 3x to 10x.
Selection errors create cascading costs through four layers: product cost, equipment damage, production downtime, and remediation labor. Production downtime is consistently the largest component.
Specification matching alone cannot prevent errors because data sheets do not capture additive chemistry interactions, material compatibility, or cross-system effects.
Every selection decision should be evaluated using a total cost framework that includes equipment impact, downtime risk, and remediation cost before the purchase, not after the failure.
Prevention-oriented approaches deliver documented returns of 545 percent or more, with every dollar invested in upstream analysis saving five to ten dollars in avoided downstream costs.
Lubinpla's platform enables mechanism-based product selection by cross-referencing product chemistry, substrate compatibility, and operating conditions simultaneously. Instead of comparing data sheets and hoping for compatibility, technical teams can evaluate the actual chemical interactions that determine whether a product will protect their system or degrade it.
What if your next product change could be validated against every material in your system before a single liter enters the line? What if the incompatibility that would have cost you USD 200,000 in downtime showed up as a flag on your screen instead of a failure on your floor? That is the shift Lubinpla enables. The question is not whether your team can afford the time to evaluate chemical compatibility upfront. The question is whether you can afford not to.
VIII. References
[1] Siemens, "The True Cost of Downtime 2024", 2024. https://assets.new.siemens.com/siemens/assets/api/uuid:1b43afb5-2d07-47f7-9eb7-893fe7d0bc59/TCOD-2024_original.pdf
[2] Innovapptive, "Reduce Unplanned Downtime: A $20 Billion Challenge in the Chemical Industry", 2024. https://www.innovapptive.com/blog/reduce-unplanned-downtime-chemical-industry
[3] Machinery Lubrication, "Study Shows Lubrication Errors Cost Manufacturers $250,000 in Downtime", 2024. https://www.machinerylubrication.com/Read/30910/lubrication-errors-downtime
[4] UpKeep, "Maintenance Statistics: Predictive & Preventive, Labor & Costs", 2024. https://upkeep.com/learning/maintenance-statistics/
[5] NIST, "The Costs and Benefits of Advanced Maintenance in Manufacturing", 2023. https://nvlpubs.nist.gov/nistpubs/ams/NIST.AMS.100-18.pdf
[6] Machinery Lubrication, "Controlling Costs with Proper Lubrication", 2023. https://www.machinerylubrication.com/Read/29561/lubrication-controlling-costs
[7] Shell, "General Manufacturing Total Cost of Ownership", 2024. https://www.shell.us/business-customers/lubricants-for-business/sector-expertise/manufacturing/general-manufacturing-total-cost-of-ownership.html
[8] Efficient Plant, "How Much Is Lubrication Costing You?", 2022. https://www.efficientplantmag.com/2022/05/how-much-is-lubrication-costing-you/
[9] Accruent, "Understanding Unplanned Downtime Costs in the Chemical Industry", 2024. https://www.accruent.com/resources/blog-posts/understanding-unplanned-downtime-costs-chemical-industry
[10] Allan Chemical Corporation, "Impact of Cleaning Chemicals on Equipment Materials", 2024. https://allanchem.com/cleaning-chemicals-equipment-materials-impact/
[11] Ralsonics, "Surface Treatment Failures: The Hidden Cost of Poor Pre-Treatment", 2024. https://www.ralsonics.com/surface-treatment-failures/
[12] Ecwamix, "Manufacturing, Operations & Cost Control: Reducing Downtime Through Smarter Chemical Selection", 2024. https://www.ecwamix.co.za/post/manufacturing-operations-cost-control-reducing-downtime-through-smarter-chemical-selection
[13] Bearing News, "The Most Common Causes of Bearing Failure and the Importance of Bearing Lubrication", 2020. https://www.bearing-news.com/the-most-common-causes-of-bearing-failure-and-the-importance-of-bearing-lubrication/
[14] Veolia, "Water Handbook - Cooling Water Corrosion Control", 2024. https://www.watertechnologies.com/handbook/chapter-24-corrosion-control-cooling-systems
[15] NIST, "Surface Engineering of Aluminum and Aluminum Alloys - Materials Data", 2024. https://materialsdata.nist.gov/bitstream/handle/11115/222/Surface%20Engineering%20of%20Al.pdf
[16] U.S. Department of Energy, "Operations & Maintenance Best Practices Guide", 2010. https://www.energy.gov/femp/articles/operations-maintenance-best-practices-guide
[17] Jones Lang LaSalle, "Preventive Maintenance ROI Study", 2023. https://micromain.com/preventive-maintenance-study/
Powered by Lubinpla
Discover how technical teams solve complex challenges faster with AI.