Moisture in transformer paper and oil: how temperature moves it
Warming drives water from paper into oil and cooling drives it back slowly, so oil moisture reflects paper moisture only near thermal equilibrium. It holds for mineral oil with cellulose insulation. Thin hot-spot winding paper nears equilibrium within days; cool barriers and thick insulation lag for months or years, and aged oil or ester fluid needs its own curve.
In a 150 MVA, 400 kV transformer with about 7 t of cellulose and 80,000 L of oil, cellulose at 3% moisture stores about 220 kg of water and the oil at 20 ppm about 2 kg (Koch, 2005).
The diffusion time constant of 1 mm oil-impregnated pressboard rises from 0.9 days at 80 °C to 93 days at 20 °C (Sparling and Aubin, posted 2010).
On a 50 MVA, 230 kV transformer, paper moisture computed from one oil reading could be anything from 1.3% to 2.5%, depending on sampling time (Sparling and Aubin, posted 2010).
After heat and vacuum oil processing of a 480 MVA, 230 kV transformer, solid insulation moisture was 1.7% against 1.8% before (Koch et al., 2009).
This explanation covers oil-immersed power transformers insulated with Kraft paper and pressboard. It sets no moisture limit for any voltage class, and its mineral oil curves do not transfer to natural or synthetic ester fluids, aramid insulation, or a tank holding free water beyond saturation.
Why does a single oil moisture reading misstate paper moisture?
A single oil moisture reading misstates transformer paper moisture because the conversion assumes that paper and oil have settled at one temperature, and a loaded transformer rarely does. The usual routine has three steps: sample the oil, measure its water by Karl Fischer titration, and read paper moisture off an equilibrium diagram, such as the curves T.V. Oommen published in 1983 (Koch et al., 2009). Koch and co-authors list the weak points in that chain: sampling, transport and titration errors, equilibrium that is rarely reached, a steep curve in the dry region, and curves that depend on the water solubility of the actual oil and cellulose (Koch et al., 2009).
Sparling and Aubin of GE Energy put the core problem plainly. With temperature conditions continuously varying, paper water content cannot be assessed correctly from one oil sample and a laboratory Karl Fischer test, "even if the oil temperature is noted at time of sampling" (Sparling and Aubin, posted 2010). Recording the temperature tells you which curve to read, but not whether paper and oil have finished exchanging water at that temperature.
The error is large. On a 50 MVA, 230 kV transformer, paper moisture computed at top oil temperature could take any value from 1.3% to 2.5%, depending on the time of sampling (Sparling and Aubin, posted 2010). Koch of the University of Stuttgart reports that paper moisture derived from oil ppm via equilibrium charts mostly came out higher than results from other measurement techniques (Koch, 2005).
Which chemistry and physics control water in transformer paper and oil?
Water in transformer paper and oil is governed by two opposite solubility trends: as temperature rises, mineral oil dissolves much more water while cellulose holds slightly less (Koch, 2005).
Mineral oil: polar impurities set its water capacity
Pure mineral transformer oil is a mix of saturated, nonpolar hydrocarbons such as paraffins and naphthenes, and on its own it cannot dissolve water (Koch, 2005). Service oil holds water because it carries refinery residues, ageing byproducts and cellulose particles. Oxidation forms alcohols, aldehydes, ketones and finally acids; all are polar and bind water through van der Waals and hydrogen bonds, so the water solubility of mineral oil increases as it ages (Koch, 2005).
Cellulose: polar glucose chains store the water
Kraft paper and pressboard are cellulose, built from polar glucose chains that bind water in several layers and hold free water in capillaries. Depending on temperature, cellulose can dissolve some thousand times more water than oil (Koch, 2005). The oil therefore acts as the transport medium for water, not the store.
Relative saturation drives the exchange
Water moves until its content relative to saturation is equal in adjacent materials: paper, oil and any gas space (Koch et al., 2006). When temperature rises, the potential of cellulose to hold water falls while that of oil rises, so water diffuses from cellulose into oil; when temperature falls, it moves back (Koch et al., 2006). Some water in aged oil is bound to oxidation products and is only partially available to move into the paper (Sparling and Aubin, posted 2010).
How does moisture migration show up in transformer oil tests?
Moisture migration shows up in transformer oil tests as an oil water content that rises and falls with temperature while the total water in the transformer hardly changes. Sparling and Aubin estimated the water balance of a transformer holding 45,000 kg of oil. At full load the oil held 26 ppm, or 1.2 kg of water; off service it held 1.3 ppm, or 0.1 kg, while the total stayed at 98.8 kg in both states (Sparling and Aubin, posted 2010).
Real loads add a daily cycle on top. On a 50 MVA, 230 kV unit with a nitrogen blanket, one week of online data showed the daily variation of oil moisture alongside relative saturation and top oil temperature (Sparling and Aubin, posted 2010). Over six months the same unit ran at about 0.5 per unit load in autumn and 0.4 per unit in winter, with top oil near 45 °C in autumn and 25 °C in winter (Sparling and Aubin, posted 2010).
Two practical consequences follow, and both are our inference from these data rather than a published rule. First, ppm results from routine samples compare fairly only when they were taken at similar oil temperature and load history. Second, a rising ppm trend can mean a warmer sampling season as easily as new water ingress. CIGRE Working Group D1.52 found that plotting relative saturation against temperature, a hysteresis plot, is an effective way to indicate the wetness of transformer insulation in service (CIGRE TB 741, 2018).
Which conditions change how far an oil moisture result can be trusted for paper?
How far an oil moisture result can be trusted for transformer paper depends on recent temperature history, where the insulation sits, the age of oil and paper, and the type of fluid. The table below decides how much weight one oil water result can carry for paper moisture under each condition; rows marked inference are our reading of the mechanism, not a measured result.
Condition | What happens to oil moisture | How to read it |
|---|---|---|
Load or ambient temperature rise | Water moves from paper into oil as oil solubility rises (Koch et al., 2006) | Oil lags behind the paper for days or longer; a ppm chart read at the new temperature likely understates paper water (inference) |
Load drop or cold night | Water moves back into cellulose, more slowly as temperature falls (Sparling and Aubin, posted 2010) | Oil still carries water from the warmer period; a chart read at the low temperature likely overstates paper water (inference) |
Steady load, thin winding paper at the hot spot | Thin hot insulation is approximately in equilibrium with the oil (CIGRE, 2024) | Usable for winding paper, read at hot-spot temperature, not sample temperature |
Barriers and bottom insulation | Usually not in equilibrium with the oil (CIGRE, 2024) | Estimate separately at bottom oil temperature; cooler barriers hold more water |
Oil aged 25 years in service | About double the water saturation level of two new mineral oils (Koch, 2005) | A ppm chart overstates paper water; use relative saturation instead |
Aged paper and pressboard | At 20 ppm in oil on the 60 °C curves, 2.9% for new Kraft paper but 2.1% for aged paper with aged oil and 1.5% for aged pressboard with aged oil (Koch et al., 2009) | Use curves matched to the ageing state of the insulation |
Natural ester fluid | Water solubility around 15 times that of mineral oil (Tenbohlen et al., 2008) | Mineral oil curves do not apply; use an ester and Kraft paper chart |
Oil just dried or processed | Paper keeps its water; oil moisture rises again within days or weeks back in service (Sparling and Aubin, posted 2010) | A low result after processing says nothing about paper dryness |
The row that misleads most often is aged oil. An oil aged by 25 years of service could dissolve double the water of two new mineral oils (Koch, 2005), so the same ppm reading means a much lower relative saturation and drier paper than a new-oil chart implies. On a 150 MVA three-winding transformer, the ppm-based chart gave 4.4% paper moisture where the relative saturation chart gave 3.0%, which agreed well with the average of dielectric response results (Koch et al., 2009). Where a row says to read at hot-spot or bottom oil temperature, the temperature of the oil sample alone is the wrong input to the chart.
How long does paper-oil moisture equilibrium take at different temperatures?
Paper-oil moisture equilibrium in a transformer takes from about a day to several years, depending mainly on temperature and insulation thickness. Sparling and Aubin tabulate diffusion time constants from earlier literature for oil-impregnated pressboard: for 1 mm they run from 0.9 days at 80 °C to 4.2 days at 60 °C, 20 days at 40 °C and 93 days at 20 °C (Sparling and Aubin, posted 2010). Their table assumes the time constant grows with the square of thickness, so 4 mm pressboard has time constants of 14 days at 80 °C and 1,493 days at 20 °C (Sparling and Aubin, posted 2010). As with any first-order process, most of the change is complete only after several time constants.
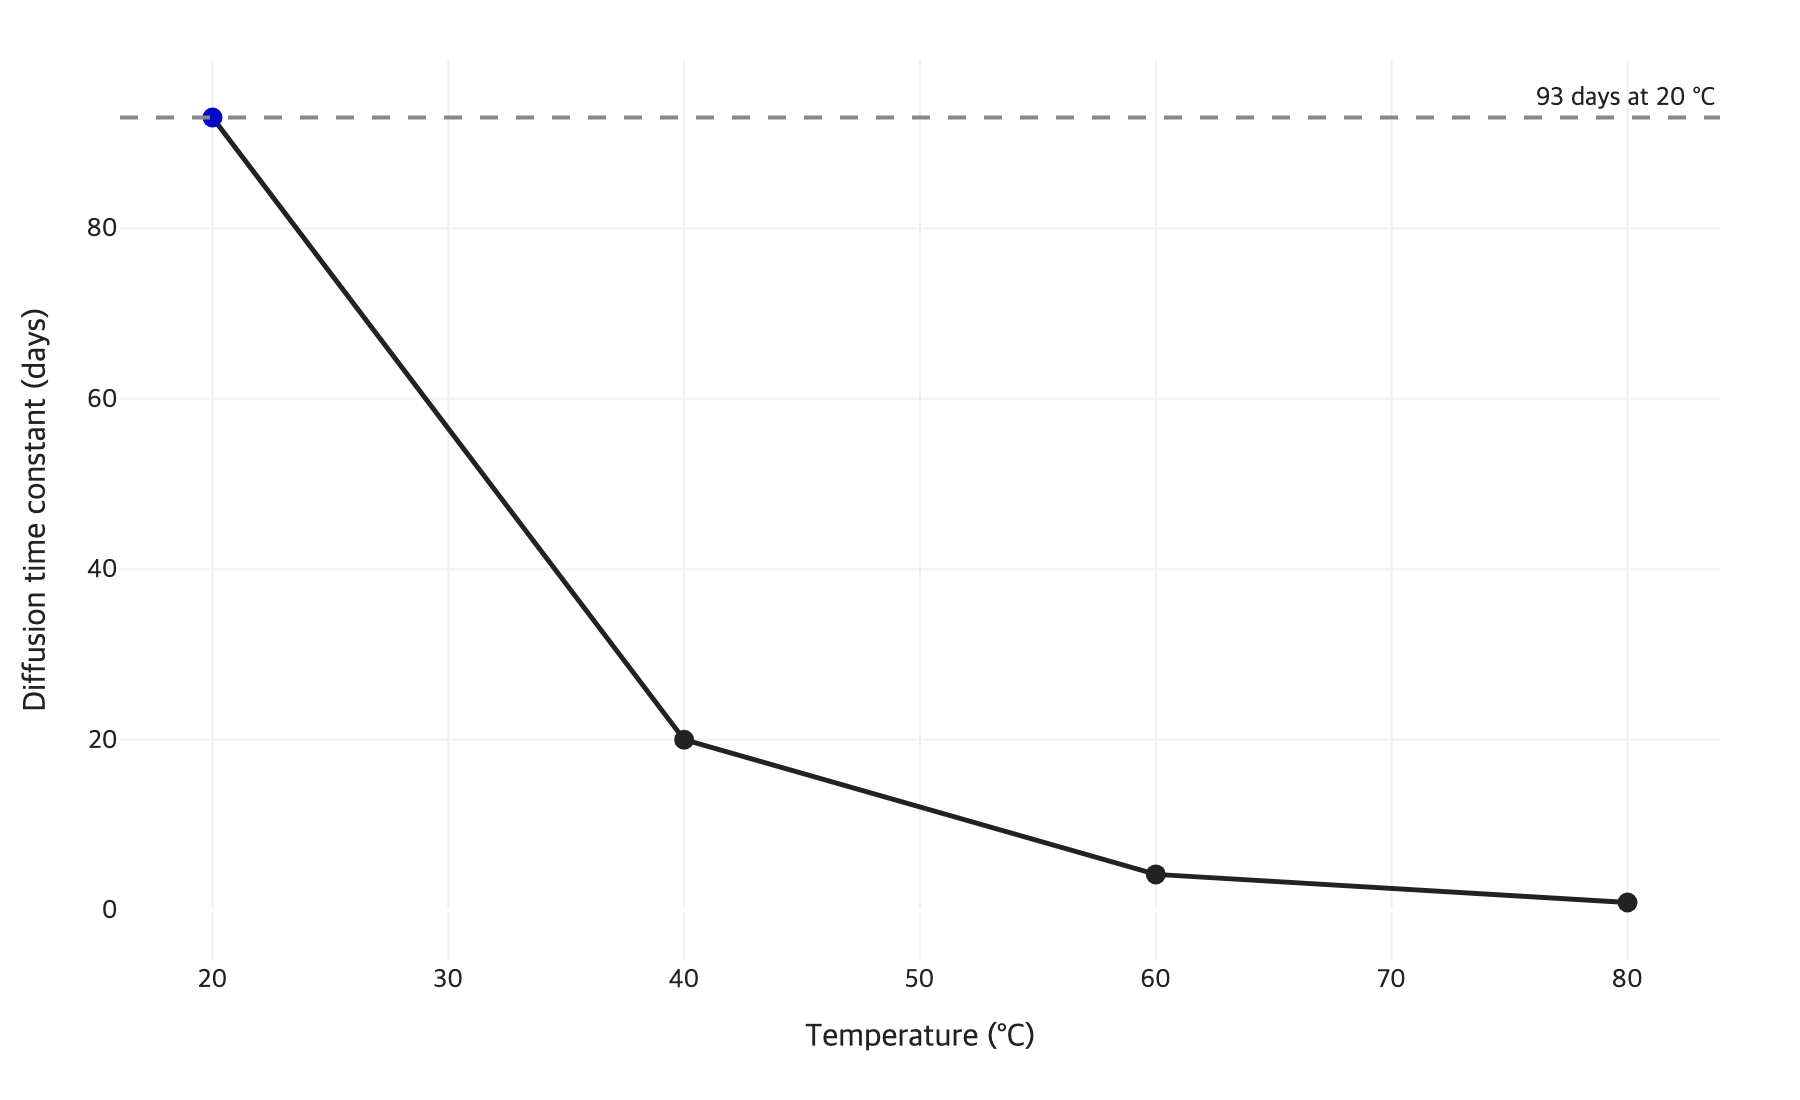
Figure 1. Moisture diffusion time constant of 1 mm oil-impregnated pressboard against temperature, as tabulated from earlier literature by Sparling and Aubin; thicker insulation is slower still. Source: Sparling and Aubin, GE Energy, posted 2010.
Field data fit this picture. On the 50 MVA, 230 kV unit, an average hot-spot temperature of about 50 °C gave a diffusion time constant of about 9 days for winding paper, which rose above 60 days in cold winter periods (Sparling and Aubin, posted 2010).
Published estimates differ widely. An empirical model from earlier literature, as reported by Koch, gives 333 h at 20 °C and 6 h at 70 °C for 1 mm oil-impregnated pressboard at 0.5% moisture, and he calls it only a rough estimation (Koch, 2005). The model also makes desorption slower than adsorption (Koch, 2005). The gap from the 93-day figure likely reflects different moisture levels and data sets; that is our inference. Both sources agree on the practical point: at low temperature, oil-impregnated pressboard hardly ever reaches equilibrium (Koch, 2005).
Why do equilibrium curves fail for aged or ester-filled transformers?
Equilibrium curves fail for aged or ester-filled transformers because each curve is valid only for the materials used to build it, and ageing or a different fluid changes how much water the oil and the cellulose can hold (Koch et al., 2009; Tenbohlen et al., 2008).
Aged oil and aged cellulose
Ageing byproducts sharply raise the water solubility of oil and slightly lower that of cellulose, which shifts the whole set of equilibrium curves toward the oil (Koch, 2005). The error can be large. On a heavily aged 30 MVA transformer built in 1950, Karl Fischer titration of paper samples gave 2.6% moisture, a relative saturation chart gave 2.5%, and the ppm-based chart gave 6.0% (Koch et al., 2009).
Natural and synthetic ester fluids
Ester fluids hold far more water than mineral oil: three natural esters tested by Tenbohlen and co-authors dissolved around 15 times more, and a synthetic ester around 40 times more (Tenbohlen et al., 2008). In their worked example, 7 t of cellulose at 3% moisture held 210 kg of water against 3 kg in 70 t of aged mineral oil at 40 °C; after exchange to a natural ester, the fluid took up 14 kg and the cellulose fell to 199 kg (Tenbohlen et al., 2008). A study co-authored by a natural ester supplier adds a chemical sink: water is consumed as a reactant with the ester liquid, producing fatty acids (Pagger et al., 2018). A mineral oil chart has no term for that reaction. IEEE C57.147-2018, the active IEEE guide for natural ester acceptance and maintenance, covers the fluid itself (IEEE SA, 2018).
Which parts of a transformer hold more moisture than the oil test suggests?
The cooler and thicker parts of transformer insulation, such as barriers near the bottom of the tank and thick pressboard, usually hold more moisture than an oil test suggests, because cellulose at lower temperature stores more water. In the steady-state model by Sparling and Aubin, about half of the water sat in the thick insulation, and the solid insulation acted as an almost unlimited reserve of water for the oil (Sparling and Aubin, posted 2010). Temperature gradients inside a winding can reach 30 K, which spreads moisture unevenly even at constant load (Koch, 2005).
Barriers matter because they carry high electric stress. On the 50 MVA, 230 kV unit, the computed moisture of the thin barriers was significantly higher than that of the winding paper, and the gap grows with load because it tracks the difference between hot-spot and bottom oil temperature (Sparling and Aubin, posted 2010). An increase in moisture from 0.5% to 3.0% may cut the partial discharge inception voltage by 50% (Sparling and Aubin, posted 2010, citing Carrander).
Unused windings behave the same way. On a 150 MVA three-winding transformer, dielectric response showed the insulation of the unused tertiary winding to be wetter than the rest (Koch et al., 2009). CIGRE notes that thin hot insulation at the hot spot is approximately in equilibrium with the liquid, but that this is usually not the case for insulation barriers (CIGRE, 2024). An oil-based estimate therefore describes an average, not the wettest component.
How do you confirm paper moisture in a real transformer?
Paper moisture in a real transformer is best confirmed by combining a relative saturation trend from an oil sensor with a dielectric response measurement, and by Karl Fischer titration of paper samples when the unit is opened.
Online relative saturation with temperature
A capacitive sensor reads relative saturation and oil temperature continuously, and averaging over a long period accounts for the slow diffusion between paper and oil (Sparling and Aubin, posted 2010). CIGRE reports that this approach is now described in IEC 60422 (CIGRE, 2024), whose current edition is IEC 60422:2024, Edition 5.0, published 2024-07-18 (IEC, 2024). Charts based on relative saturation largely remove the effect of oil ageing (Koch et al., 2009).
Dielectric response
Polarisation and depolarisation current and frequency domain spectroscopy methods calculate water in the solid insulation from its dielectric properties; for new, dry transformers the very low frequencies matter, down to 100 µHz (Koch et al., 2009). Software without compensation for conductive ageing products gave 3.8% and 4% on the aged 1950 unit, against 2.9% with compensation and 2.6% from paper samples (Koch et al., 2009).
Karl Fischer titration of paper samples
IEC 60814:1997, Edition 2.0, covers coulometric Karl Fischer determination of water in insulating liquids and oil-impregnated paper and pressboard (IEC, 1997). Results depend on heating temperature and moisture ingress during handling, and round robin tests showed unsatisfactory agreement between laboratories (Koch et al., 2009).
How should moisture-in-paper estimates guide drying decisions?
Moisture-in-paper estimates are a sound basis for transformer drying decisions when they come from a temperature-corrected trend or a direct method, because drying targets the cellulose, where most of the water sits. Moisture lowers dielectric strength, speeds cellulose ageing and can release gas bubbles at high temperature (Koch et al., 2009).
Fixed oil ppm limits carry the equilibrium assumption with them. IEEE C57.106-2002 inferred permissible paper moisture from oil water content, assuming thermal stability and equilibrium (Sparling and Aubin, posted 2010), and IEEE lists the later C57.106-2015 as an Inactive-Reserved standard, inactivated on 2026-03-26 (IEEE SA, 2026). Check which edition of which guide your organization applies before quoting a limit.
The drying method has to reach the paper. On a 480 MVA, 230 kV generator step-up transformer, oil processing with heat at 50 °C and vacuum left solid insulation moisture at 1.7% against 1.8% before, because the cellulose stores about 200 times more water than the oil (Koch et al., 2009). Traditional hot oil circulation removes moisture mainly from the oil (Sparling and Aubin, posted 2010). Continuous online oil circulation for 1.5 years lowered the solid insulation moisture of a 150 MVA transformer by about 1.2 percentage points (Koch et al., 2009). Permanently installed molecular sieves have proven effective on transformers with oil capacities of up to 30,000 litres and rely on service load to drive water out of the paper (Sparling and Aubin, posted 2010).
Lubinpla, an applied AI company, works this kind of case from the owner's own documents and site history and returns one cited document for review, with each step approved by the user. Base the decision on the paper estimate, choose the method by where the water sits, and set a stop criterion from the same trend.
Key takeaways
An oil water result in ppm describes water in transit; the store is the cellulose.
Read paper moisture from relative saturation and temperature history, not from one sample.
Winding paper near the hot spot equilibrates in days; barriers and thick insulation can take months or years.
Aged oil and ester fluids need their own curves; a new mineral oil chart overstates paper moisture in aged units.
Drying must reach the cellulose; oil processing alone leaves the paper wet.
Lubinpla applies this kind of reasoning to your own documents and site history and drafts the document for your review before it goes out.
Sources checked 2026-10-14.
Sources
Sparling B., Aubin J. (GE Energy). Assessing water content in insulating paper of power transformers. Undated paper, posted by the IEEE PES St. Louis chapter for its 2010-12-06 meeting. https://ewh.ieee.org/soc/pes/saintlouis/2010%2012%206/Moisture-in-Insulation_Paper.pdf
Koch M. (University of Stuttgart). Improved determination of moisture in oil-paper-insulations by specialised moisture equilibrium charts. Proceedings of the XIVth International Symposium on High Voltage Engineering, Beijing, 2005. https://www.ieh.uni-stuttgart.de/dokumente/publikationen/2005_Koch_ISH2005_Beijing_Moisture.pdf
Koch M., Tenbohlen S., Stirl T. Advanced online moisture measurements in power transformers. CMD 2006 International Conference on Condition Monitoring and Diagnosis, Changwon, 2006. https://www.ieh.uni-stuttgart.de/dokumente/publikationen/2006_Web_CMD_2006_Koch_Advanced_Online_Moisture_Measurements.pdf
Koch M., Krüger M., Tenbohlen S. Comparing various moisture determination methods for power transformers. CIGRE Southern Africa Regional Conference, 2009. https://www.ieh.uni-stuttgart.de/dokumente/publikationen/2009_Cigre_Koch_Comparing_Various_Moisture_Determinations.pdf
Tenbohlen S., Koch M., Vukovic D., Weinläder A. et al. Application of vegetable oil-based insulating fluids to hermetically sealed power transformers. CIGRE 2008, paper A2-102. https://www.ieh.uni-stuttgart.de/dokumente/publikationen/2008_Cigre_Vukovic_Application_of_vegetable_oil-based.pdf
Pagger E., Muhr M., Braunstein R., Tieber M., Rapp K., Sbravati A. Natural ester FR3 insulating liquid, very paper friendly. Technical paper hosted by Cargill, file dated 2018. https://www.cargill.com/doc/1432160417505/fr3-full-paper_all_20180131_v2.pdf
CIGRE Study Committee A2. Terms of reference, JWG A2/D1.74, Online moisture monitoring of transformers for ageing assessment. Approved 2024-08-13. https://cigre-usnc.org/wp-content/uploads/2024/08/TOR-JWG-A2_D1_74_Online-moisture-monitoring-of-transformers-for-ageing-assessment-rev1.pdf
CIGRE WG D1.52. Technical Brochure 741, Moisture measurement and assessment in transformer insulation, evaluation of chemical methods and moisture capacitive sensors. 2018. https://e-cigre.org/publication/741-moisture-measurement-and-assessment-in-transformer-insulation-evaluation-of-chemical-methods-and-moisture-capacitive-sensors-2
IEC. IEC 60814:1997, Edition 2.0, Insulating liquids, oil-impregnated paper and pressboard, determination of water by automatic coulometric Karl Fischer titration. https://webstore.iec.ch/en/publication/3572
IEC. IEC 60422:2024, Edition 5.0, Mineral insulating oils in electrical equipment, supervision and maintenance guidance. https://webstore.iec.ch/en/publication/66421
IEEE SA. IEEE C57.106-2015, Guide for acceptance and maintenance of insulating mineral oil in electrical equipment, status page (Inactive-Reserved, inactivated 2026-03-26). https://standards.ieee.org/ieee/C57.106/5361/
IEEE SA. IEEE C57.147-2018, Guide for acceptance and maintenance of natural ester insulating liquid in transformers, status page (Active Standard). https://standards.ieee.org/ieee/C57.147/6717/
Written by the Lubinpla team from the sources listed and checked against them before publication.