Metalworking Fluid Troubleshooting Flowchart: Product or Use?
Summary
To decide if a coolant complaint is the product, check concentration, pH, tramp oil and bacteria against HSE MW5 and supplier limits first. This metalworking fluid troubleshooting flowchart puts those checks in order for a supplier's technical service engineer, a distributor's application specialist or a plant coolant coordinator. The lot is judged last, after measurement, water and operating changes.
UK guidance treats dipslide results at or above 10^6 cfu/mL as poor control that normally means draining and cleaning the system (HSE MW5, 2021).
UK guidance recommends keeping tramp oil below 2 percent, checked weekly (HSE MW5, 2021).
One coolant supplier calls poor concentration the number one issue in a fluid problem and always the first item to examine (DuBois Chemicals, accessed 2026).
STLE reports that a lab dilution in plant water more than 0.5 pH units outside the supplier's range could be due to chemical changes in the concentrate (STLE, 2022).
This flowchart covers water-mix metalworking fluids (soluble oils, semi-synthetics and synthetics) in machine sumps and central systems. It does not cover straight oils, worker health complaints or machine faults unrelated to the fluid, and the ranges on the product's own data sheet take precedence over the generic values here.
When should you use the coolant product-or-use-conditions flowchart?
Use the coolant product-or-use-conditions flowchart when a customer or a shop floor blames a water-mix metalworking fluid for a problem, such as rust on parts, odor, foam, residue, short tool life or emulsion split, and someone has to say whether the product or the way it is used explains it. The flowchart suits a coolant supplier's technical service engineer, a distributor's application specialist or a plant coolant coordinator who will put the verdict in writing.
The flowchart exists because most coolant complaints have more than one cause in play at once. STLE's review of field problems puts it plainly: some issues are related to the fluid, others are influenced by operational variables, and "many (if not most) factors are interdependent" (STLE, 2022). A troubleshooting list that names twelve problems and twelve fixes helps the shop, but it does not tell the supplier whether to open a product investigation. The flowchart fixes the order of checks so that the cheap, common use-condition causes are ruled out with recorded evidence before anyone examines the lot.
Run it at the first report of a complaint, before any dump, biocide addition or product change. A sump dumped before sampling destroys the evidence the later steps need, and a change of product made before the use conditions are checked tells you nothing about either product. The editable Word chart, with a blank copy and a separate illustrative example, is at the end of this page.
What data do you need before running the metalworking fluid troubleshooting flowchart?
The metalworking fluid troubleshooting flowchart needs the complaint, the recent fluid records and the product documents before step 1, because each step compares a measured value with a range set before the measurement. Collect the following.
The complaint in the customer's words: what was seen, on which machines and parts, and the date it started.
The product data sheet with the concentration range, pH range, refractometer factor and water quality advice. Blaser Swisslube notes that the real concentration is the refractometer reading multiplied by the product's refractometer factor, found on its data sheet (Blaser Swisslube, accessed 2026).
Recent fluid records: concentration, pH, tramp oil and dipslide results with dates and sample points. HSE MW5 recommends measuring concentration and pH weekly and keeping records of all tests for at least five years (HSE MW5, 2021).
Makeup water hardness and pH, which HSE MW5 also asks users to check (HSE MW5, 2021).
What changed near the start date: work material, machine, tooling, speeds and feeds, filtration, mixing method, cleaners, season or part storage.
The lot number of the concentrate in use, its certificate of analysis and, if the supplier keeps one, a retained sample of that lot.
A fresh sample from the stirred sump, taken before any correction.
If one item is missing, the flowchart still runs, but the step that needs it ends as "not checked" and the verdict cannot exclude that cause.
Which checks come first in a metalworking fluid troubleshooting flowchart?
The checks that come first in a metalworking fluid troubleshooting flowchart are measurement validity and concentration, because a wrong reading or a wrong mix explains more complaints than anything else and costs least to check. The table below gives the eight steps in order, each with its threshold, its source and where to go next.
Step and criterion | Threshold (source) | If met | If not |
|---|---|---|---|
1 Measurement valid | Refractometer reading times the product factor (Blaser Swisslube, accessed 2026); sump stirred before sampling (HSE MW5, 2021); sample dated | Go to 2 | Re-measure; no verdict on invalid data |
2 Concentration in range | Supplier data sheet range; examine first (DuBois Chemicals, accessed 2026) | Go to 3 | Correct, retest after two system turnovers (STLE, 2022); finding A if the complaint stops |
3 pH in range, stable trend | Supplier range; sustained drop above 0.5 units versus fresh mix to be avoided, a German rule to limit N-nitrosamine formation (TRGS 611, 2007) | Go to 4 | Find the cause in steps 4 to 6; finding A or B |
4 Makeup water in spec | Supplier water advice; 200 ppm or more is hard and can cause tackiness with some chemistries (DuBois Chemicals, accessed 2026) | Go to 5 | Treat or change water; finding A |
5 Tramp oil low | Below 2 percent, weekly (HSE MW5, 2021) | Go to 6 | Find the leak, skim; finding A |
6 Microbes controlled | Dipslide below 10^4 cfu/mL; 10^6 cfu/mL or more is poor control (HSE MW5, 2021) | Go to 7 | Sump management; finding A, or B if it recurs fast |
7 No operating change | Material, machine, speeds, filtration, mixing, cleaner, storage unchanged near onset | Go to 8 | Test the change; finding A if reversing it clears the complaint |
8 Lot in specification | Lot within its certificate; fresh lab dilution in plant water within 0.5 pH units of the supplier range (STLE, 2022) | Outcome A or B | Outcome C if steps 1 to 7 found nothing; Outcome B if a use condition was also found |
The key row is step 2: DuBois Chemicals calls poor concentration the number one issue when investigating a fluid problem and always the first item to examine and correct (DuBois Chemicals, accessed 2026).
The chart uses the product's own data sheet range for concentration and pH because published ranges differ by product. Blaser Swisslube gives an ideal pH of 8.4 to 9.2 for most of its products (Blaser Swisslube, accessed 2026), DuBois Chemicals gives 8.0 to 9.5 (DuBois Chemicals, accessed 2026), and Master Fluid Solutions writes that most water-based fluids are designed to operate at 8.5 to 9.5 (Master Fluid Solutions, 2026). A pH of 8.4 passes one of those ranges and fails another, so the chart never applies a generic pH limit to a named product. For step 6, a dipslide takes 36 to 48 hours or longer to show colonies, while ATP measurement under ASTM E2694-26 cuts that delay to about 5 minutes (ASTM E2694-26). STLE adds a persistence test: dipslides repeated over several weeks above 100,000 cfu/mL for bacteria or 1,000 cfu/mL for fungi suggest that fluid components are partially degraded (STLE, 2022). Step 7 is a record check, not a measurement, so it has no numeric threshold; what it needs is the date each change was made.
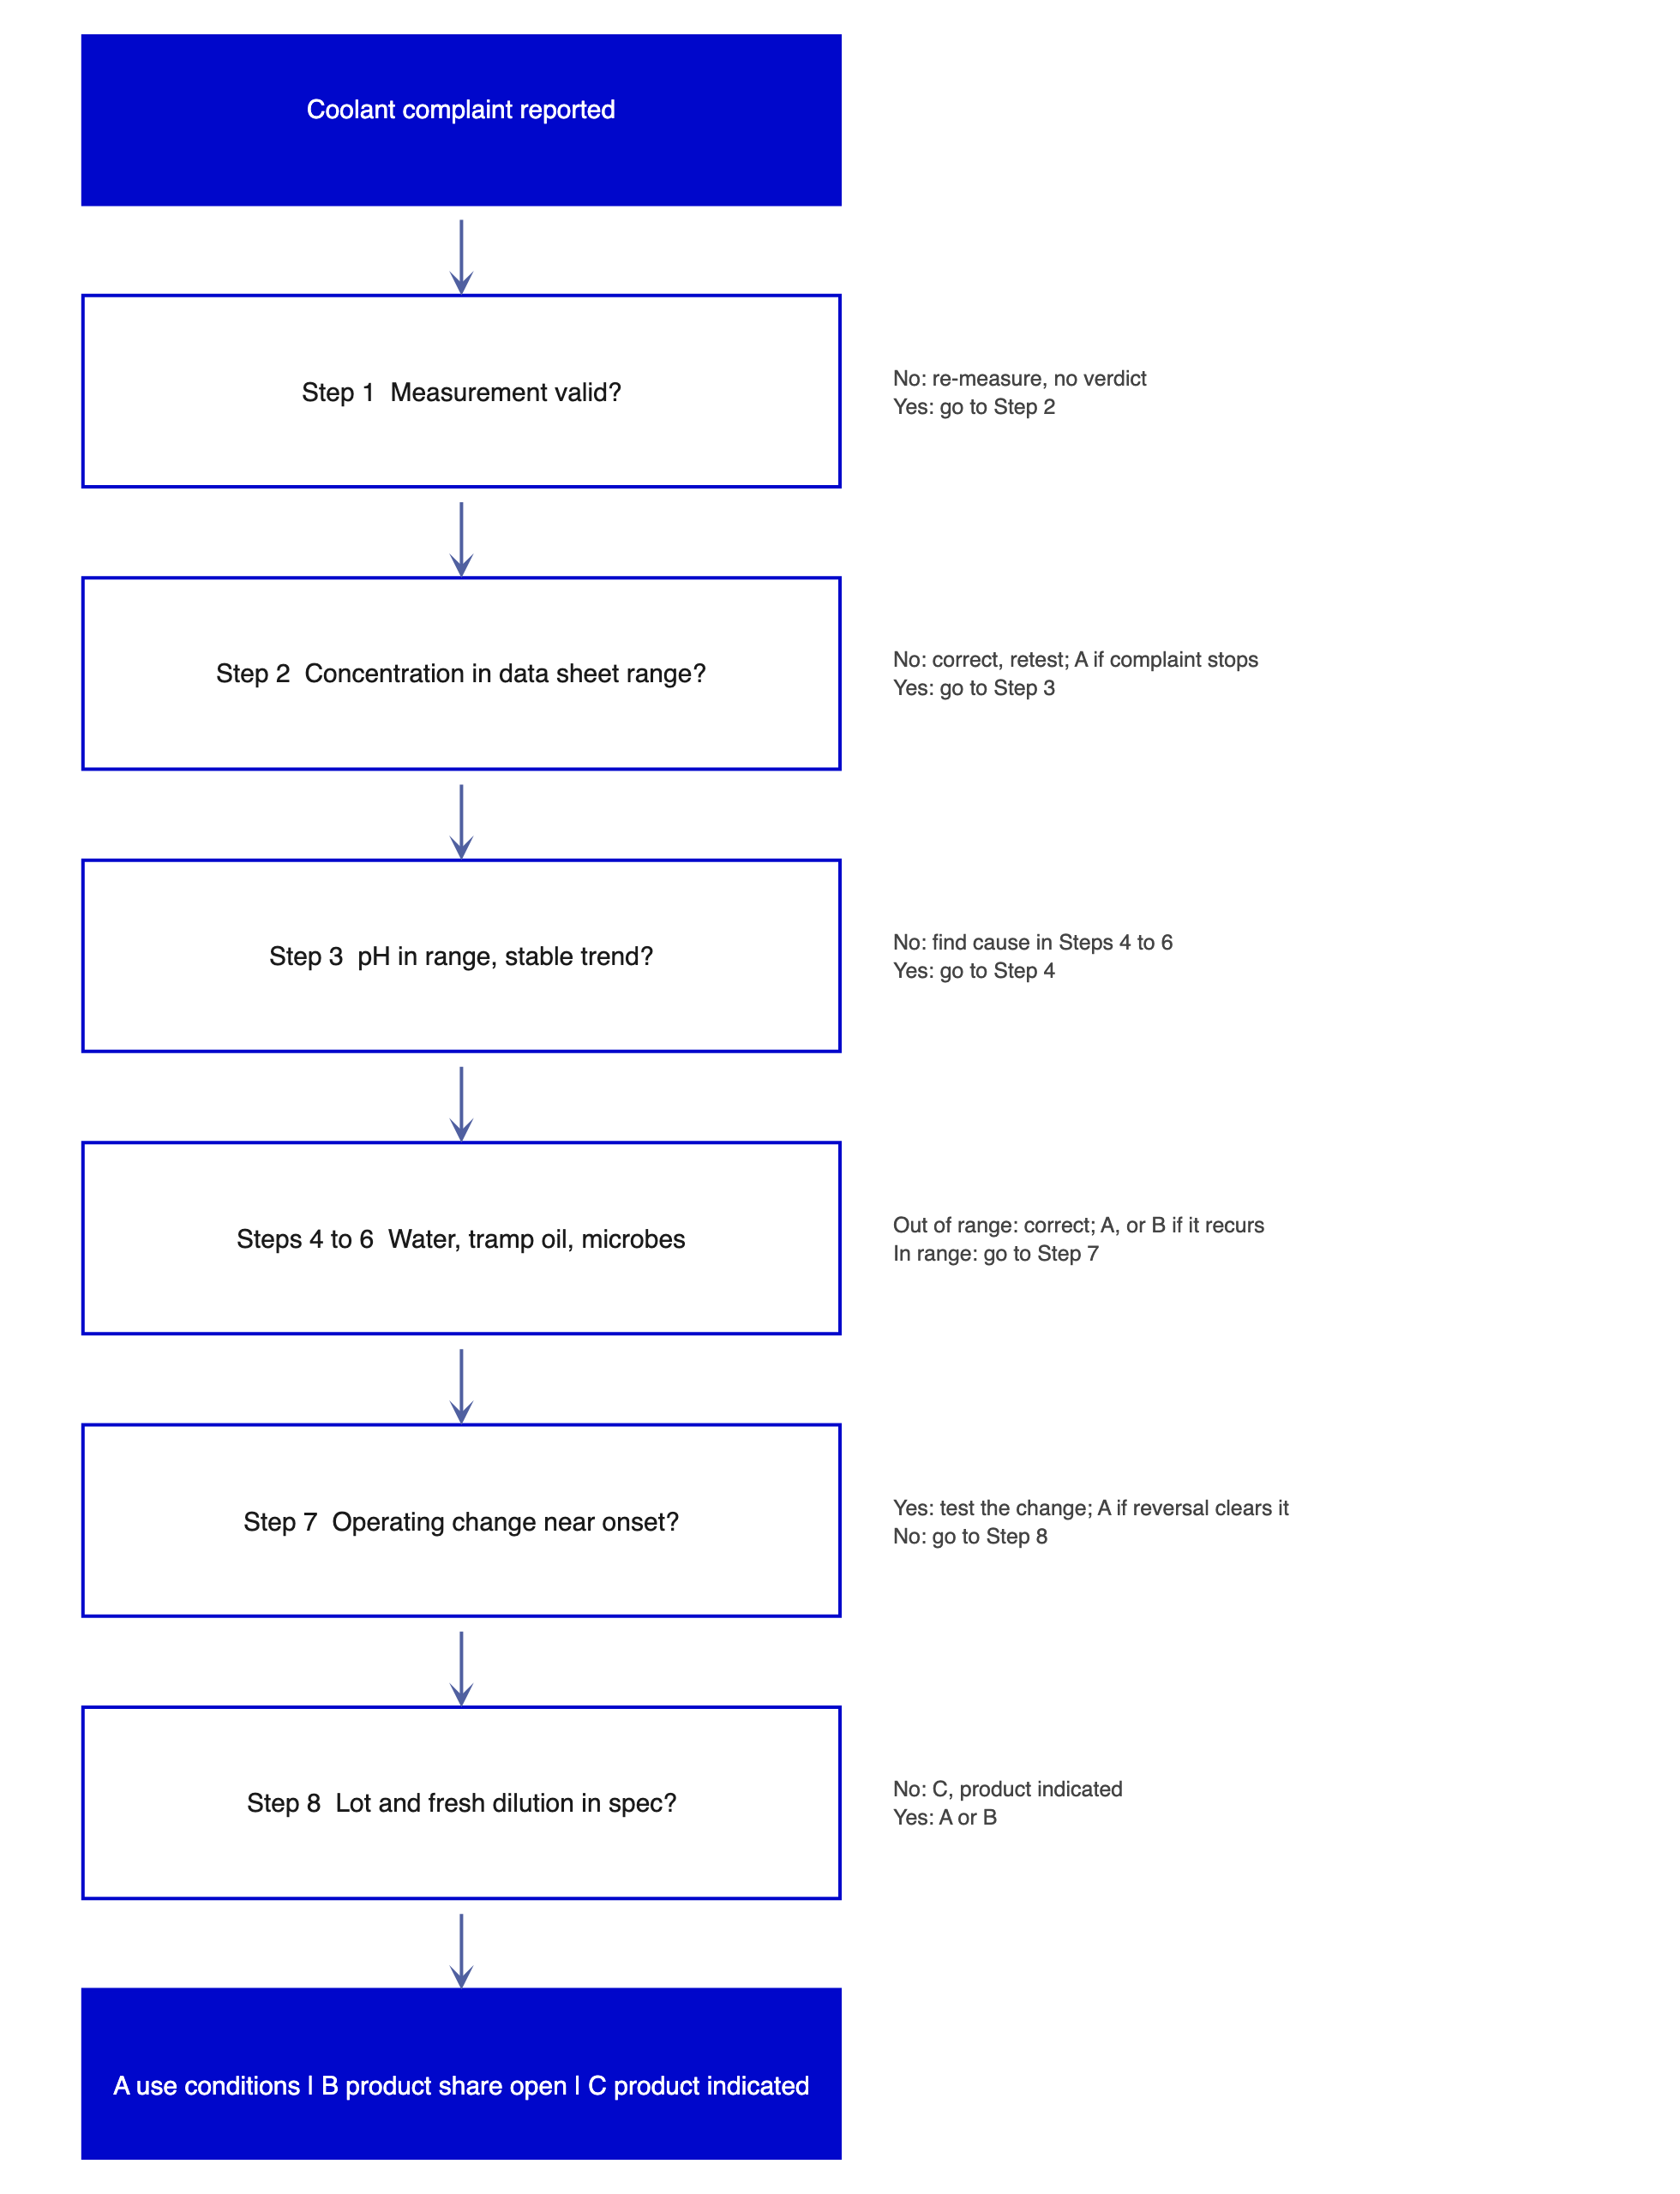
Figure 1. Order of checks in the coolant product-or-use-conditions flowchart; thresholds are in the table above. Source: compiled from HSE MW5 (2021), STLE (2022) and the cited supplier guides.
Which coolant problems come from use conditions rather than the product?
Coolant problems that come from use conditions rather than the product are those that follow concentration, water, tramp oil, microbial load, mixing or an operating change, and that stop when that condition is corrected. These account for most of the steps in the flowchart.
Concentration drift is the commonest. HSE MW5 notes that water-mix fluids evaporate in use and become more concentrated, so top-ups should be made with fluid below the recommended concentration (HSE MW5, 2021). STLE links parts corrosion and staining to concentration outside the supplier's range and recommends a refractometer check at the start of every shift (STLE, 2022). Mixing matters too: DuBois Chemicals advises always adding concentrate to water (DuBois Chemicals, accessed 2026).
Water and contamination come next. Hard makeup water can make some chemistries tacky (DuBois Chemicals, accessed 2026), while STLE reports that soft water below 75 ppm total hardness can worsen foaming (STLE, 2022). Blaser Swisslube notes that a sharp pH drop may come from low emulsion concentration or heavy tramp oil leakage, and an alkaline cleaner can push pH up (Blaser Swisslube, accessed 2026).
Microbial growth is a use condition when the sump, not the fluid, carries it. STLE notes that a system not cleaned thoroughly before a new charge can hold residual microorganisms that cause rapid pH changes (STLE, 2022). In each case the evidence that settles it is the same: the condition was out of range, it was corrected, and the complaint stopped. That is finding A.
When does a coolant problem point to the product itself?
A coolant problem points to the product itself when steps 1 to 7 are within range, or were corrected without removing the complaint, and the lot or a fresh dilution of it fails a check that the use conditions cannot affect. Three findings carry that weight.
The first is a lot outside its own certificate or specification, which is a fact about the concentrate before it reached the sump. The second is a lab dilution that is wrong from the start. STLE recommends verifying the pH of the fluid properly diluted in the lab with plant water, and reports that a pH more than 0.5 units above or below the supplier's range "could be due to chemical changes in the MRF concentrate," possibly from storage beyond the use-by date (STLE, 2022). The third is a reproduced failure: when corrosion or staining occurs with a freshly diluted fluid, STLE suggests simulating the problem in the lab using the relevant alloys and the plant dilution water, and reports that the formulation may need adjustment (STLE, 2022).
A fourth pattern leaves the product share open rather than indicated. When microbial counts return quickly after a correct clean and recharge, or reserve alkalinity falls fast with concentration in range, STLE suggests the supplier may need to substitute a fluid with higher reserve alkalinity or greater bioresistance (STLE, 2022). That points to fit between product and site, not to a defective lot, and the verdict should say so.
How do you read the three outcomes of the coolant troubleshooting flowchart?
The coolant troubleshooting flowchart ends in one of three outcomes, and each one states what the evidence shows and what it does not.
Outcome A, use conditions explain it, holds when at least one step from 1 to 7 found a condition outside its range and correcting that condition removed the complaint. The lot check in step 8 still runs, because a clean lot result makes the verdict stronger, but it is not what decides it.
Outcome B, product share open, holds in four cases: a use condition was found and corrected but the complaint continued; no use condition was found and the lot either could not be checked, for example because no retained sample exists, or passed step 8; the pattern suggests a mismatch between the product and the site, such as fast microbial regrowth; or step 8 failed while a use condition was also found. Outcome B names the next check and who owns it, rather than closing the case.
Outcome C, product indicated, holds when steps 1 to 7 show no condition that explains the complaint and step 8 finds the lot outside its certificate, a fresh dilution outside the supplier's pH range by more than 0.5 units (STLE, 2022), or a lab simulation that reproduces the failure. Outcome C opens a product investigation with the maker; it is not yet a root cause.
Each outcome should list the steps marked "not checked". A verdict of A with step 6 unchecked is weaker than one with every step recorded, and the reader is entitled to know which.
Coolant troubleshooting flowchart worked example (illustrative)
The coolant troubleshooting flowchart worked example below is illustrative: the shop, values and dates are invented to show how the steps are recorded, and they come from no real case. A machining shop reports rust spots on cast iron parts two days after a new drum of semi-synthetic coolant was put into service, and asks whether the new lot is bad.
Step | Finding (illustrative) | Status |
|---|---|---|
1 Measurement | Refractometer 3.0 Brix, product factor 1.1, sump stirred, dated | Valid |
2 Concentration | 3.3 percent against a data sheet range of 5 to 7 percent | Out, corrected to 6 percent |
3 pH | 8.6, within the data sheet range of 8.5 to 9.3 | In |
4 Makeup water | 180 ppm hardness, within the supplier's water advice | In |
5 Tramp oil | 1 percent | In |
6 Microbes | Dipslide 10^3 cfu/mL | In |
7 Operating change | New drum mixed by hand into the sump instead of through the proportioner | Change found |
8 Lot | Certificate within specification; lab dilution in plant water pH 8.9 | In |
In this illustrative case the concentration was low because the new drum was poured into the sump by hand, and the rust stopped after the concentration was corrected and the fluid had turned over twice. The verdict is outcome A, use conditions explain it, with the lot check in step 8 recorded as within specification. The report to the shop names the mixing change as the cause and the corrective action as returning to the proportioner, and it states that the lot was checked and not implicated. A distributor reading this record later can see why the product was cleared without calling anyone.
How do you report a coolant complaint verdict to the customer?
A coolant complaint verdict is reported to the customer as the outcome, the evidence for each step, and what remains open, in that order, with every value carrying its date, sample point, method and range source. Lead with one sentence that states the outcome and the main cause, such as "Use conditions explain the rust: concentration was below the data sheet range after manual mixing."
Then give the step table with measured values beside the thresholds, marking each step as in range, out of range or not checked. Separate what was measured from what is inferred: "concentration was 3.3 percent" is measured, while "the rust followed the low concentration" is an inference supported by the complaint stopping after correction. Name the corrective action, who owns it and when it will be rechecked. If the lot was examined, state the lot number, the certificate result and whether a retained or fresh sample was tested.
Avoid two common faults. A verdict that blames the shop without data will be rejected, and one that defends the product without step 8 will not be believed. HSE MW5 also asks that when a third party does the checks, the user reviews the results and the remedial actions taken (HSE MW5, 2021), so the report should be written for that review. Lubinpla's performance evaluation task fixes the measurement criteria before results arrive, binds each result to its sample and method, and separates the fluid's performance state from the product's contribution, so a result the use conditions explain is not counted as a product finding.
When does the coolant troubleshooting flowchart not apply?
The coolant troubleshooting flowchart does not apply to fluids, complaints or systems outside water-mix metalworking fluid performance. Straight (neat) oils are not diluted with water (ASTM E1497-23), so steps 2 to 6 do not fit them; HSE gives neat oils separate guidance in MW4 (HSE MW5, 2021).
Worker health complaints, such as dermatitis or breathing problems, are not product-performance questions. HSE MW5 lists lung disease from mist and dermatitis from skin exposure among the hazards of these fluids (HSE MW5, 2021), and such a complaint goes to an occupational health specialist, not to this chart. Machining of glass or ceramics also shifts the pH logic: German rules allow monthly rather than weekly pH checks there because alkaline inorganic substances carry into the fluid (TRGS 611, 2007).
Some corrective steps in the chart carry their own safety rules. A biocide is added only after good practice measures have been followed and only at the dose the supplier recommends (HSE MW5, 2021), and in the US it must be registered by the EPA for metalworking fluid use (OSHA Metalworking Fluids manual); read the product's safety data sheet before handling it. Draining and cleaning a large enclosed sump may create a confined space risk (HSE MW3, 2021), and spent fluid is disposed of under section 13 of its safety data sheet (OSHA, 29 CFR 1910.1200). Finally, the chart does not replace a laboratory analysis or the maker's investigation when outcome C is reached.
Key takeaways
Check measurement and concentration first; they explain the most complaints.
Run steps 3 to 7 before examining the product lot.
A use condition counts as the cause only when correcting it stops the complaint.
The product is indicated by the lot or a fresh dilution, not by the sump.
Report the outcome, the step evidence and what was not checked.