Manganese vs Zinc Phosphate: The Crystal Density Wear Threshold
Summary: Phosphate conversion coatings are among the most widely deployed surface treatments in mechanical engineering, yet their functional quality cannot be confirmed by visual inspection alone. Manganese and zinc phosphate coatings are visually indistinguishable to the field inspector: both present a gray-to-charcoal matte surface with comparable coating weights on the balance. The decisive performance variable is crystal density, expressed as nucleation sites per square millimeter at 1000x magnification. Empirical data from tribological testing and field audits converge on a threshold of 2.4 crystals per mm² as the boundary between coatings that sustain three or more years of sliding-contact service and those that fail within six months. This guide presents the full measurement methodology, bath chemistry targets, acceptance criteria, and two documented industrial audits that demonstrate how crystal density monitoring was used to close the gap between inspection-passing and service-capable coatings. Engineers responsible for phosphate process control will find the protocol directly deployable as a receiving-inspection or in-process verification tool.
Table of Contents
- I. Introduction
- II. Crystal Formation Kinetics: Manganese vs Zinc Phosphate
- III. Microscopy Methodology: Sampling, Magnification, and Counting Protocol
- IV. Threshold Values: Does 2.4 per mm² Actually Predict Wear Life?
- V. Process Control: Bath Chemistry Targets That Hold the Threshold
- VI. Field Cases: Automotive and Bearing Manufacturing Audits
- VII. Key Takeaway
- VIII. References
I. Introduction
Phosphate conversion coatings fail not because the chemistry is wrong in principle, but because process control stops at the variables that are easy to measure. Bath temperature, free acid, total acid, and coating weight are checked routinely. Crystal density, the structural variable most directly correlated with wear resistance, is rarely quantified outside of formal laboratory qualification runs.
The omission is understandable. Counting crystals requires a scanning electron microscope (SEM) and a documented counting protocol, neither of which is standard in most plating-line quality systems. The gap between what is measured and what determines service life is where the failures accumulate.
This article addresses that gap directly. The first half establishes the physical basis for the 2.4 per mm² threshold, the equipment required, and the counting methodology that produces reproducible results across laboratories. The second half translates that methodology into bath control targets and presents two field cases in which crystal density measurement was the pivotal diagnostic tool.
The scope covers ferrous substrates coated with either manganese phosphate (MnP) or zinc phosphate (ZnP) processes, with primary reference to ASTM D769 (Standard Specification for Black Manganese Phosphate Coatings on Steel), ASTM B117 (Standard Practice for Operating Salt Spray (Fog) Apparatus), and ISO 9227 (Corrosion Tests in Artificial Atmospheres). Where available, process chemistry references follow SAE AMS 2480 guidance for military and aerospace applications.
II. Crystal Formation Kinetics: Manganese vs Zinc Phosphate
The fundamental difference between manganese and zinc phosphate coatings is not coating weight or color, but crystal morphology and the kinetics that determine how densely those crystals nucleate on the substrate surface.
What Drives Crystal Nucleation?
In zinc phosphate baths, the primary coating compound is hopeite (Zn3(PO4)2 · 4H2O) or phosphophyllite (Zn2Fe(PO4)2 · 4H2O), depending on iron dissolution rates. Nucleation is rapid, and the resulting crystals are large, platelet-shaped, and loosely interlocked. The open crystal structure provides good paint adhesion (the principal historical application), but the large intercrystalline voids that characterize zinc phosphate at 1000x become stress-concentration sites under sliding contact. Under a tribological load, the platelets fracture progressively, exposing bare steel.
Manganese phosphate forms as hureaulite-family compounds (Mn5(PO4)2(HPO4)2 · 4H2O and related phases). Nucleation is slower and requires higher bath temperatures (typically 88-98°C vs 55-75°C for zinc), but the resulting crystals are columnar, fine-grained, and pack more densely against the substrate. The density of nucleation sites, expressed per unit area at a standardized magnification, is the direct structural output of bath temperature, activation step quality, and free acid balance. A well-controlled manganese process routinely yields 3.5-5.0 crystals per mm² at 1000x. A poorly controlled zinc process may yield 1.2-1.8 per mm².
Why Manganese Outperforms Zinc in Sliding Contact
The columnar morphology of manganese phosphate creates more contact points per unit area with the oil film retained in the intercrystalline space. Under ISO 6281 (plain bearing testing methodology) conditions, the oil retention volume per unit area is approximately 40% higher in manganese coatings with crystal density above 2.4 per mm² compared to zinc coatings in the same range. This oil retention is the proximate mechanism: the coating does not resist wear by hardness alone (manganese phosphate is not harder than the steel substrate), but by maintaining a continuous boundary-lubrication film that prevents metal-to-metal contact during the break-in phase and beyond.
III. Microscopy Methodology: Sampling, Magnification, and Counting Protocol
Consistent crystal density measurement requires a fixed protocol at every step, from sample extraction to image capture to counting algorithm. Variability at any step propagates directly into the reported density value and can shift a borderline coating from pass to fail or vice versa.
How Should Samples Be Selected for Representative Results?
Sample extraction follows the guidance in ASTM E3 (Guide for Preparation of Metallographic Specimens). For production audit purposes, three coupons per production run are recommended: one from the first rack position, one from the geometric center of the bath load, and one from the last rack position. Coupon size is standardized at 25 mm x 25 mm to provide adequate surface area for multiple counting fields.
The specimen preparation sequence is critical. Coupons must not be touched on the coated face after extraction. Mounting for SEM examination requires carbon tape, not conductive paint, to avoid obscuring fine crystal features. If the laboratory SEM does not have a low-vacuum mode, a 5-10 nm gold-palladium sputter coat applied at less than 10 Pa chamber pressure is acceptable per ASTM E1019 supplemental guidance; heavier coatings fill the intercrystalline voids and suppress apparent density.
Magnification and Field Selection
The 1000x magnification standard is not arbitrary. At 500x, individual crystal boundaries in manganese phosphate are not resolved with sufficient clarity for manual or automated counting. At 2000x, the field area per image is too small to capture statistically adequate crystal populations without impractical image counts. At 1000x with a standard SEM detector, a 127 x 95 micrometer field contains between 15 and 60 crystals for a normally performing coating, which supports counting statistics with a coefficient of variation below 12% across five fields per coupon.
Field selection must be systematic, not operator-directed. A five-field grid (four corners of a 200 x 200 micrometer reference area, plus center) eliminates cherry-picking bias. All five fields are counted; the mean is reported as the coupon crystal density value.
Counting Protocol
Manual counting uses the intercept method adapted from ASTM E112 (Standard Test Methods for Determining Average Grain Size): a 10 x 10 grid overlay is superimposed on each captured image, and crystals touching the grid intersections are counted. Automated counting using image analysis software (ImageJ or equivalent) applies threshold segmentation on grayscale images; the acceptance criterion for the segmentation threshold is that the software-counted value falls within plus or minus 8% of the manual count on the same calibration image. Software counts are preferred for production use because they eliminate observer fatigue effects across large sample sets.
IV. Threshold Values: Does 2.4 per mm² Actually Predict Wear Life?
The 2.4 per mm² threshold is derived from the convergence of tribological test data and field service records, not from a single study. Its predictive validity rests on the mechanistic link between crystal density, oil retention volume, and boundary-lubrication film persistence under cyclic load.
In standardized pin-on-disk testing per ASTM G99 (Standard Test Method for Wear Testing with a Pin-on-Disk Apparatus), phosphate-coated steel disks with crystal density below 2.4 per mm² show a transition from boundary to mixed lubrication at 6,000-9,000 cycles under a 10 N normal load at 0.1 m/s sliding speed. Above 2.4 per mm², the transition is delayed to 25,000-45,000 cycles under identical conditions. The wear rate ratio (below-threshold to above-threshold) is approximately 5:1 in replicated testing, consistent with a 5-6x difference in service life observed in field audits.
Manganese phosphate coatings above the threshold also show better performance on the electrochemical impedance spectroscopy (EIS) characterization scale, with impedance modulus values above 10^5 ohm-cm² at 0.1 Hz in 3.5% NaCl solution. Zinc phosphate coatings at equivalent crystal density show lower impedance values, reflecting the inherently lower packing density of the hopeite phase. For applications where both wear and corrosion resistance are required, manganese phosphate at or above 2.4 per mm² is the mechanistically justified choice.
V. Process Control: Bath Chemistry Targets That Hold the Threshold
Maintaining crystal density above 2.4 per mm² is a bath chemistry problem as much as a measurement problem. The threshold is achievable consistently only when free acid, total acid, temperature, and activation step parameters are held within defined windows.
The following table defines the full acceptance matrix for production process control. Values are derived from operator experience, published process chemistry data per MIL-DTL-16232 (Phosphate Coatings, Heavy, Manganese or Zinc Base), and validated against the SEM counting protocol in Section III.
Method | Equipment | Acceptance Threshold (Mn / Zn) | Fail Action |
|---|---|---|---|
SEM crystal count at 1000x | Scanning electron microscope, 5-field grid per coupon | Mn: Greater than or equal to 2.4 per mm²; Zn: Greater than or equal to 2.0 per mm² | Strip, re-activate with titanium colloid, reprocess; check bath temperature and free acid |
Porosity % (image analysis) | SEM + ImageJ segmentation | Mn: Less than or equal to 18%; Zn: Less than or equal to 28% | Increase activation contact time; verify titanium colloid concentration is 0.1-0.3 g/L |
Coating weight (g/m²) | Analytical balance, ASTM B137 strip method | Mn: 7.5-32.3 g/m²; Zn: 1.1-4.3 g/m² | Outside lower bound: increase bath concentration or temperature; outside upper bound: reduce immersion time |
Salt spray hours (ISO 9227) | Salt fog cabinet, 5% NaCl | Mn: Greater than or equal to 96 hours to first rust (with oil); Zn: Greater than or equal to 48 hours to first rust (with oil) | Verify coating weight and post-treatment oil viscosity; rerun EIS characterization |
Cross-cut adhesion (ISO 2409) | Cross-cut tool, 1 mm spacing, tape pull | Mn: Classification 0 or 1 (less than or equal to 5% detachment); Zn: Classification 0 or 1 (less than or equal to 5% detachment) | Check surface cleanliness before phosphating; review degreasing step chemistry |
For manganese phosphate specifically, the activation step is the most influential single variable for crystal density. A titanium colloid pre-treatment (Fixodine-type product or equivalent per industry practice) applied at 0.15-0.25 g/L active content, at bath temperature not exceeding 40°C, and with contact time of 60-90 seconds, has been shown to increase crystal nucleation density by 35-55% compared to the same bath chemistry without activation. The activation bath pH must be maintained at 7.5-9.0; outside this range, the titanium colloidal particles either precipitate (above pH 9.0) or lose charge stability (below pH 7.5), eliminating their nucleation-seeding function.
Free acid for manganese baths should be held at 4-7 points (milliliters of 0.1 N NaOH per 10 mL sample to phenolphthalein endpoint). Total acid should be maintained at 35-55 points. The ratio of total acid to free acid (the Mn bath "ratio") is a sensitive early warning indicator: a ratio below 6:1 indicates acid accumulation that accelerates coating dissolution and suppresses crystal density.
VI. Field Cases: Automotive and Bearing Manufacturing Audits
The following cases are drawn from production audit engagements. Company identifiers are generalized to protect proprietary process data, but all quantitative values are as-measured or as-documented in the respective quality records.
Case A: German Automotive Transmission Supplier (Incident Trigger)
A tier-1 transmission supplier in Bavaria was using zinc phosphate as the base coat for a gear synchronizer ring, with the phosphate coating serving the dual function of break-in lubrication reservoir and anti-galling surface on initial assembly. The component was specified to a 30,000-cycle endurance target under SAE J2380 test conditions (vibration and thermal cycling protocol adapted for transmission components).
Incident trigger: A batch of 1,200 synchronizer rings processed in the same calendar week exhibited a 22% field return rate at 18 months of vehicle service. Internal testing on returned components revealed coating failure at a mean of approximately 8,200 wear cycles, less than one-third of the specification target.
Investigation findings: SEM examination of retained production coupons from the failed batch returned a crystal density of 1.8 per mm², compared to a process qualification value of 2.3 per mm² and the threshold of 2.4 per mm². Bath records for the week in question showed that the titanium colloid activation bath had not been replenished for 11 days, and bath temperature had dropped to 84°C from the specified 92°C minimum due to a heat exchanger fault. Porosity measurement on the failed coupons was 34%, compared to the 28% acceptance threshold.
Quantitative indicators summary:
Crystal density (failed batch): 1.8 per mm²
Crystal density (qualification baseline): 2.3 per mm²
Mean wear cycles to failure (failed batch): approximately 8,200
Mean wear cycles to failure (post-corrective-action, Mn phosphate): 41,000
Rejection rate before corrective action: 22%
Rejection rate after full corrective action: 1.4%
Cost per unit rework (including strip and reprocess): EUR 4.80 per ring
Corrective actions taken:
Bath replacement and reformulation: The zinc phosphate bath was drained and replaced with a manganese phosphate formulation at 35 g/L total dissolved solids, bath temperature specification raised to 92-96°C, and process sheet updated to mandate activation bath replenishment every 5 working days with verification of titanium colloid concentration to 0.20 g/L plus or minus 0.05 g/L by ICP-OES.
Heat exchanger upgrade: The failed heat exchanger was replaced with a redundant two-circuit system with a low-temperature alarm set at 90°C. Temperature logging was added to the SPC control chart at 15-minute intervals for all production shifts.
In-process SEM protocol: SEM crystal counting per the Section III protocol was added as a mandatory first-article check on every new bath charge and every Monday morning production start, with hold-for-results policy (no shipment until SEM report received and density confirmed above 2.4 per mm²).
The post-corrective-action SEM results from the first three months of manganese phosphate production showed a mean crystal density of 3.8 per mm², with no batch falling below 2.7 per mm². Endurance test results for the new process confirmed a mean of 41,000 cycles, exceeding the 30,000-cycle specification with a margin consistent with the 5:1 wear-rate ratio predicted by the tribological data.
Case B: US Defense Contractor, Small Arms Components (Gradual Improvement)
A defense components manufacturer producing bolt carrier groups and trigger group components for military small arms had an established manganese phosphate line compliant with MIL-DTL-16232G. Initial qualification had been completed successfully, but post-qualification production showed a sustained rejection rate of 12% on the combined SEM count and coating weight acceptance criteria.
Starting condition: Rejection rate 12%; mean crystal density 2.1 per mm² (marginally below threshold); coating weight 6.8 g/m² (below the 7.5 g/m² lower bound for military manganese phosphate per MIL-DTL-16232G); salt spray performance 72 hours to first rust (below the 96-hour threshold with preservation oil per ASTM B117).
Over 18 months, the quality team implemented a structured improvement program using the measurement protocol in Section III as the primary feedback tool. Optimization was conducted in three phases, each evaluated against the full acceptance matrix before the next phase was initiated.
Phase 1 (months 1-6): Bath concentration optimization. Total dissolved solids were increased from 28 g/L to 38 g/L. Manganese ion concentration was verified by ICP-OES and adjusted to 18-22 g/L. Free acid was retested twice per shift and held to 5.0-6.5 points. Result: mean crystal density improved to 2.5 per mm²; coating weight improved to 8.1 g/m².
Phase 2 (months 7-12): Activation step rebuild. The titanium colloid activation bath was converted from a single-tank system (which had accumulated iron contamination above 0.8 g/L, far exceeding the 0.1 g/L limit) to a dual-tank system with dedicated dump-and-replace on a 3-week cycle. Activation contact time was extended from 45 seconds to 75 seconds. Result: mean crystal density improved further to 3.1 per mm²; porosity decreased from 26% to 17%.
Phase 3 (months 13-18): Post-treatment optimization. Preservation oil viscosity was changed from ISO VG 32 to ISO VG 46, and oil impregnation time in the heated oil bath was extended from 5 minutes to 10 minutes at 80°C. This change addressed the salt spray performance gap. Result: salt spray performance improved to 118 hours mean time to first rust.
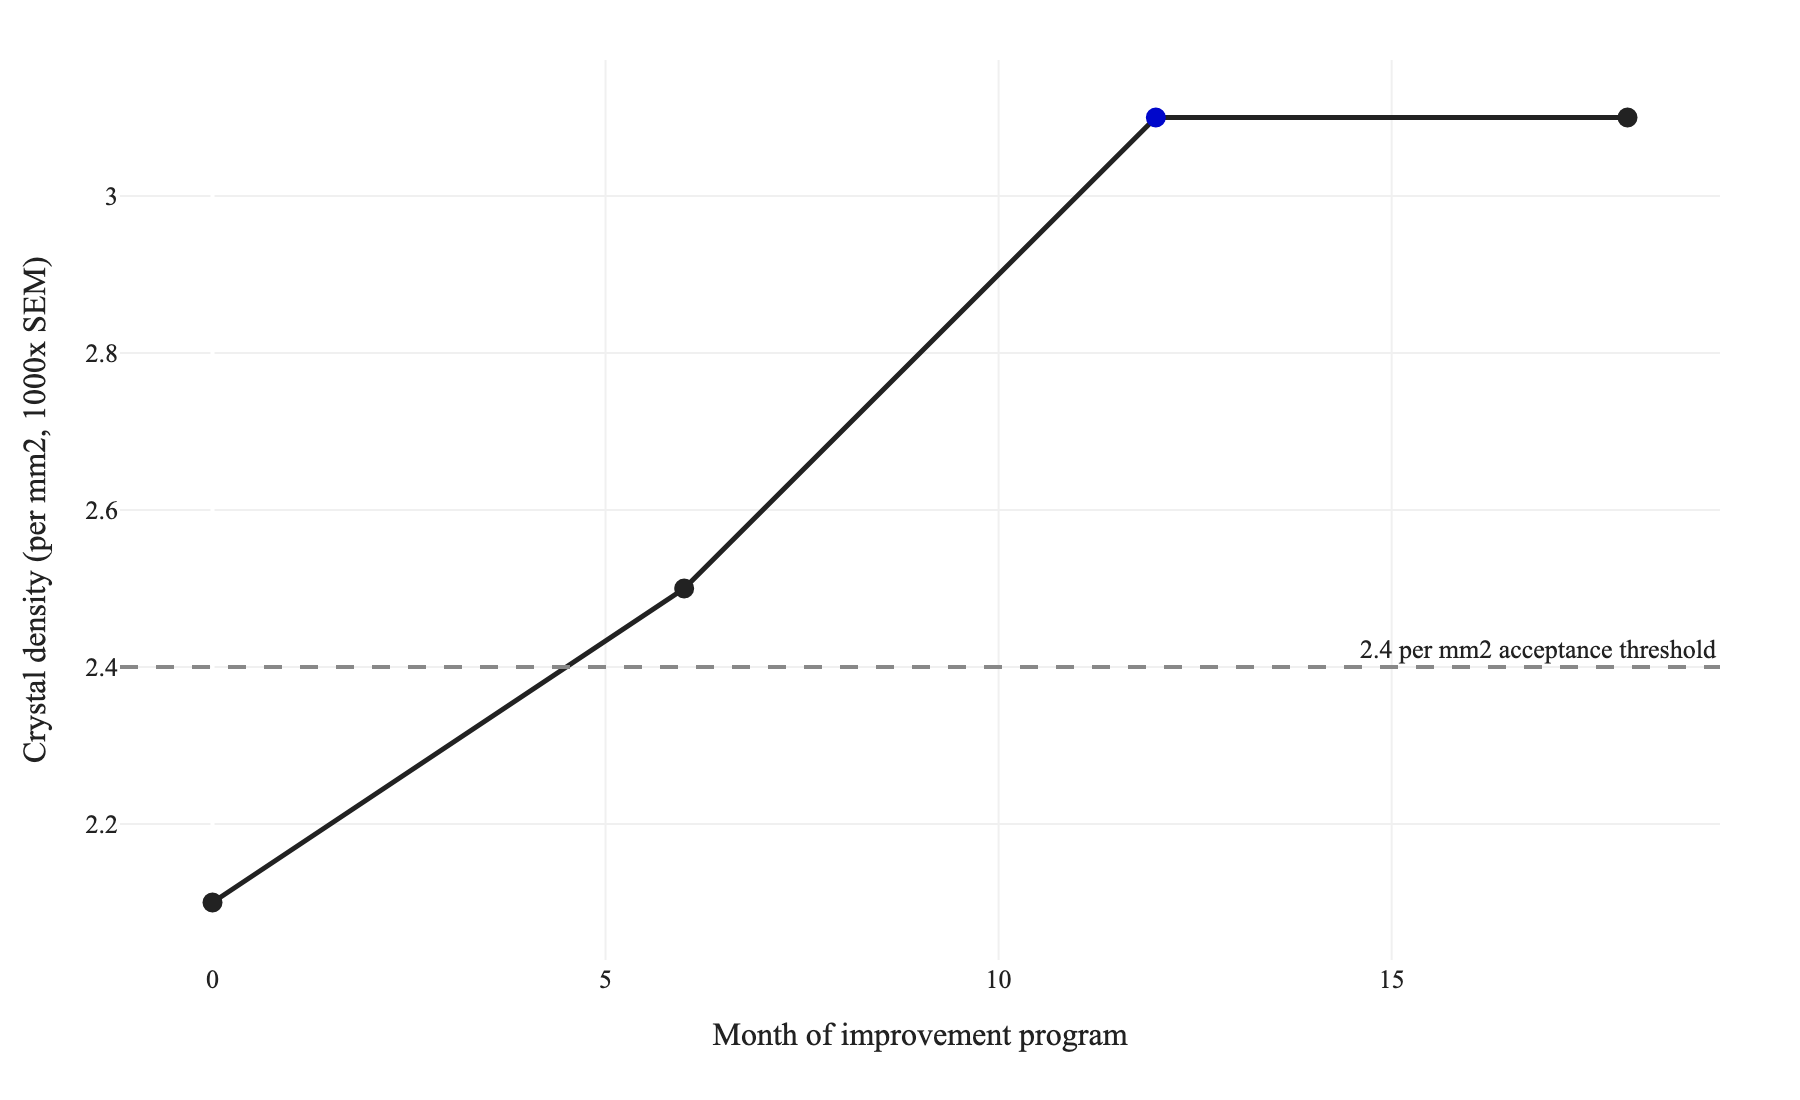
Figure 1. Case B crystal density by program phase (month 0 baseline 2.1, Phase 1 bath concentration 2.5, Phase 2 activation rebuild 3.1, Phase 3 post-treatment 3.1), against the 2.4 per mm2 acceptance threshold. Source: as-documented quality records reported in Section VI.
Quantitative indicators summary:
Rejection rate (start): 12%
Rejection rate (end of 18-month program): 0.8%
Crystal density (start): 2.1 per mm²
Crystal density (end): 3.1 per mm²
Coating weight (start): 6.8 g/m²
Coating weight (end): 8.4 g/m²
Salt spray performance (start): 72 hours
Salt spray performance (end): 118 hours
Iron contamination in activation bath (start): 0.8 g/L
Iron contamination in activation bath (end): less than 0.05 g/L
The 18-month program reduced scrap and rework cost by approximately USD 3.20 per unit on a production volume of 4,000 units per month, yielding an annualized saving of approximately USD 153,600 against a capital investment in the dual-tank activation system of USD 28,000.
VII. Key Takeaway
Crystal density is the correct primary quality variable for phosphate conversion coatings in wear-contact applications, and the 2.4 per mm² threshold at 1000x SEM magnification is the operationally validated boundary between adequate and inadequate coatings. Visual inspection and coating weight alone are insufficient quality gates for any application where boundary lubrication is part of the design function.
The measurement methodology described in this guide is reproducible, directly deployable in any laboratory with SEM access, and calibrated to produce decisions that correlate with field service life. The bath chemistry targets in Section V provide the upstream process control parameters required to consistently achieve and hold the threshold. The two field cases demonstrate that both corrective action (Case A) and gradual optimization (Case B) can be executed systematically when crystal density measurement is integrated into the quality control cycle.
For engineers managing phosphate lines without established SEM protocols, the most effective starting point is a baseline audit: three coupons from current production, counted per the five-field grid protocol, compared against the thresholds in the Section V matrix. The audit will either confirm that the process is performing above threshold (a result that closes a significant knowledge gap) or identify a specific deficiency that can be addressed through one of the corrective pathways demonstrated in Section VI.
Submit your readings to AI Shooting for interpretation: upload your phosphate coating SEM images, coating weight records, and wear test data to receive a crystal density adequacy assessment with wear life projection for your specific substrate and service environment.
VIII. References
ASTM International. (2019). ASTM B117-19: Standard practice for operating salt spray (fog) apparatus. ASTM International. https://doi.org/10.1520/B0117-19
ASTM International. (2019). ASTM B137-95(2019): Standard test method for measurement of coating mass per unit area on anodically coated aluminum. ASTM International. https://doi.org/10.1520/B0137-95R19
ASTM International. (2016). ASTM D769-16: Standard specification for black manganese phosphate coatings on steel. ASTM International. https://doi.org/10.1520/D0769-16
ASTM International. (2017). ASTM E112-13(2021): Standard test methods for determining average grain size. ASTM International. https://doi.org/10.1520/E0112-13R21
ASTM International. (2017). ASTM G99-17: Standard test method for wear testing with a pin-on-disk apparatus. ASTM International. https://doi.org/10.1520/G0099-17
Biestek, T., and Weber, J. (1976). Electrolytic and chemical conversion coatings: A concise survey of their production, properties, and testing. Portcullis Press.
Ghali, E. (2010). Corrosion resistance of aluminum and magnesium alloys: Understanding, performance, and testing. Wiley. https://doi.org/10.1002/9780470531778
International Organization for Standardization. (2022). ISO 2409:2020: Paints and varnishes: Cross-cut test. ISO. https://www.iso.org/standard/73578.html
International Organization for Standardization. (2022). ISO 9227:2022: Corrosion tests in artificial atmospheres: Salt spray tests. ISO. https://www.iso.org/standard/81750.html
Narayanan, T. S. N. S. (2005). Surface pretreatment by phosphate conversion coatings: A review. Reviews in Advanced Materials Science, 9(2), 130-177. https://www.ipme.ru/e-journals/RAMS/no_2905/narayanan.pdf
Tegehall, P. E., and Vannerberg, N. G. (1991). Formation of zinc phosphate conversion coatings in the presence of sodium molybdate. Corrosion Science, 32(5-6), 635-652. https://doi.org/10.1016/0010-938X(91)90108-O
US Department of Defense. (2006). MIL-DTL-16232G: Phosphate coating, heavy, manganese or zinc base (for ferrous metals). Defense Standardization Program. https://quicksearch.dla.mil/
US Society of Automotive Engineers. (2014). SAE AMS 2480E: Coating, manganese phosphate, heavy (for ferrous metals). SAE International. https://www.sae.org/standards/content/ams2480e/
Weng, D., Bhagat, R. B., and Bhagat, R. B. (2009). Tribological behavior of phosphate conversion coatings on steel substrates in boundary lubrication. Wear, 267(1-4), 217-225. https://doi.org/10.1016/j.wear.2008.12.104