Optimizing Metalworking Fluid Concentration for Tool Life and Surface Finish
Summary: Most metalworking operations run their cutting fluids at a single fixed concentration regardless of the machining operation being performed, sacrificing either tool life or fluid cost depending on which direction the compromise leans. This article explains how fluid concentration affects the three critical functions of metalworking fluids (lubrication, cooling, and chip evacuation), provides operation-specific concentration targets for finishing, roughing, and threading/tapping operations, and presents a practical tracking method to quantify the cost benefit of concentration optimization. The analysis demonstrates that matching concentration to operation type can extend tool life by 15 to 30 percent and reduce fluid consumption by 10 to 20 percent simultaneously.
Table of Contents
I. The Cost of Running a Single Fixed Concentration
II. How Concentration Affects the Three Critical Fluid Functions
III. Operation-Specific Concentration Targets
IV. Implementation: Adjusting Concentration in Practice
V. Concentration Drift, Biological Stability, and Common Pitfalls
VI. Tracking and Quantifying the Cost Benefit
VII. Key Takeaway
VIII. References
I. The Cost of Running a Single Fixed Concentration
A CNC machining cell runs semi-synthetic metalworking fluid at 8 percent concentration for all operations: rough milling, finish milling, drilling, and tapping. The concentration was set when the fluid was first introduced and has been maintained at that level for three years. The shop considers the fluid "dialed in" because there are no catastrophic failures. What the shop does not see is the cost of the compromise hidden in its operating data.
At 8 percent, the fluid provides more lubricity than needed for high-speed finish milling, where cooling capacity is the limiting factor. The excess oil fraction reduces heat transfer capability, allowing workpiece temperatures to rise and surface finish to suffer. Simultaneously, 8 percent provides barely adequate lubricity for tapping, where EP performance prevents thread tearing and tap breakage. The tapping operation consumes taps at a rate the shop considers normal but that could be reduced by 25 to 40 percent with a higher concentration (MSC Direct, 2024).
This dual penalty is the inherent cost of a single fixed concentration. The alternative is operation-matched concentration management, where fluid concentration is adjusted for each operation type.
The Scale of the Opportunity
Direct fluid purchase costs represent 3 to 7 percent of total machining costs. When preparation, maintenance, waste treatment, and disposal are included, total fluid-related costs reach 10 to 17 percent (Q8 Oils, 2024). However, fluid performance directly influences tool costs (25 to 30 percent of total cost) and machine downtime (15 to 20 percent). A fluid optimization that extends tool life by 20 percent has a cost impact far exceeding the fluid cost itself (Impact Fluids, 2024).
Why Shops Default to a Single Concentration
The single-concentration default persists because operators find it simpler to maintain one target number, and fluid supplier training materials typically recommend a single range for "general machining" without distinguishing between operation types. When a shop has no systematic way to track tool life by operation type, the connection between concentration and tool performance remains invisible. The optimization described in this article requires only modest changes to daily practice, but it does require treating concentration as a tunable process variable rather than a fixed parameter.
II. How Concentration Affects the Three Critical Fluid Functions
Metalworking fluids serve three simultaneous functions during machining: lubrication (reducing friction at the tool-workpiece interface), cooling (removing heat from the cutting zone), and chip evacuation (flushing chips away from the cutting zone). Fluid concentration affects each function differently, creating trade-offs that must be balanced for each operation type.
Lubrication: Boundary Film Formation
The lubrication function is provided by the oil fraction and EP additives in the concentrate. At the tool-chip interface, temperatures and pressures breach the hydrodynamic fluid film. EP additives then react with the metal surface to form solid boundary lubricant films (iron sulfide, iron phosphide, iron chloride) that prevent metal-to-metal contact.
Higher concentration delivers more oil and EP additive to the cutting zone, providing stronger boundary lubrication. This is critical for operations with high contact pressure such as tapping, broaching, and gear cutting, where inadequate lubrication causes accelerated tool wear and built-up edge formation. Research on titanium alloy machining has demonstrated that tool life first extends with increasing concentration and then drops beyond the optimal range, confirming that a concentration sweet spot exists rather than a simple "more is better" relationship (ScienceDirect, 2024).
Cooling: Heat Transfer Capacity
The cooling function is provided primarily by the water fraction. Water has a specific heat capacity of 4.18 kJ/kg per degree C, approximately twice that of mineral oil (approximately 2.0 kJ/kg per degree C). Higher water content (lower concentration) provides better heat transfer from the cutting zone.
For high-speed operations where heat generation is the primary concern, maximizing cooling capacity by running at lower concentration is advantageous. The additional oil fraction at higher concentrations impedes heat transfer by increasing viscosity and reducing the emulsion's specific heat capacity.
Chip Evacuation: Viscosity Effects
Chip evacuation is influenced by fluid viscosity, flow rate, and delivery pressure. Higher concentration increases emulsion viscosity, which can improve chip transport in horizontal applications. However, excessive viscosity in deep-hole drilling or gun drilling can impede chip clearance through the flute, causing chip packing and tool breakage. Most general machining operations are adequately served within the standard 5 to 10 percent concentration range.
Tramp Oil Interference
Tramp oil contamination introduces an additional variable that complicates concentration management. Machine tools use slideway lubricants and spindle oils that ultimately end up in the coolant sump. This contamination alters the effective concentration by adding non-functional oil to the emulsion. Unlike metalworking fluid concentrate, tramp oil does not contain EP additives or emulsifiers, so it increases viscosity and reduces cooling performance without providing corresponding lubrication benefit. Research has shown that continuous hydraulic oil contamination can cause tool life to vary by up to 70 percent, making machining performance unpredictable regardless of the nominal refractometer reading (Springer, 2020). Regular tramp oil removal through skimming or coalescence is a prerequisite for effective concentration optimization.
Figure 1. Concentration Effect on Fluid Function Performance
Fluid Function | Low Concentration (4-5%) | Standard Concentration (6-8%) | High Concentration (9-12%) |
|---|---|---|---|
Lubrication (EP performance) | Insufficient for heavy cuts | Adequate for general machining | Optimal for high-pressure operations |
Cooling (heat removal) | Maximum cooling capacity | Good cooling capacity | Reduced cooling (higher viscosity) |
Chip evacuation | Low viscosity, good flushing | Balanced | Higher viscosity, may impede in deep holes |
Corrosion protection | Minimal protection | Adequate protection | Strong protection |
Foam tendency | Low | Moderate | Higher (more surfactant) |
Fluid cost per liter | Lowest | Moderate | Highest |
The table reveals the fundamental trade-off: operations requiring maximum lubrication benefit from higher concentration, while operations requiring maximum cooling benefit from lower concentration. No single concentration optimizes all functions simultaneously.
III. Operation-Specific Concentration Targets
The following framework provides concentration targets for each major machining operation category. These targets are starting points to be refined based on specific workpiece materials, tooling, and machine capabilities. Every fluid is formulated to work within a manufacturer-specified concentration range, and the targets below should be applied within those boundaries (Production Machining, 2024).
High-Speed Finishing (Lower Concentration for Cooling)
Finish milling, finish turning, and high-speed drilling in aluminum and non-ferrous alloys generate significant heat but moderate cutting forces. The priority is cooling capacity to maintain dimensional accuracy and surface finish quality. Target concentration: 4 to 6 percent. The lower oil content maximizes heat transfer while providing adequate lubrication for the moderate cutting forces involved.
At these lower concentrations, corrosion protection is reduced, so parts should not remain in the machine sump for extended periods. Monitoring sump concentration more frequently (daily refractometer checks) is important because evaporation causes concentration to rise over time, inadvertently shifting the fluid toward higher concentration and reduced cooling performance. Watch for built-up edge formation at the lower end of the concentration range, which indicates lubrication has dropped below the minimum threshold for the alloy and cutting parameters in use.
General Roughing (Standard Concentration for Balance)
Roughing operations (rough milling, rough turning, standard drilling) balance moderate heat generation with moderate cutting forces. The standard concentration range of 6 to 8 percent provides an adequate balance of cooling and lubrication for most roughing operations on steel and cast iron.
Within this range, harder materials and deeper cuts benefit from the upper end (7 to 8 percent) for improved lubricity, while softer materials and lighter roughing passes can use the lower end (6 to 7 percent) for better cooling. Cast iron, where graphite inclusions act as a natural lubricant, generally requires only the lower end. Austenitic stainless steels with their tendency toward work hardening benefit from the upper end to reduce cutting forces and minimize work-hardened layer depth.
Threading and Tapping (Higher Concentration for EP Performance)
Tapping, threading, broaching, and gear cutting generate extreme contact pressures at relatively low speeds. Lubrication and EP performance are the dominant requirements. Target concentration: 8 to 12 percent. The higher oil and EP additive content provides the boundary lubrication necessary to prevent thread tearing, tap breakage, and excessive tool wear (ChemCeed, 2024).
For difficult materials (stainless steel, titanium, high-temperature alloys), concentrations at the upper end (10 to 12 percent) are justified by the high cost of tap replacement and the criticality of thread quality. A single broken tap embedded in a workpiece can result in scrapping the entire part, making the cost of additional concentrate negligible compared to the risk it mitigates.
Figure 2. Operation-Concentration Optimization Matrix
Operation Category | Speed Profile | Primary Requirement | Target Concentration (%) | Key Benefit |
|---|---|---|---|---|
High-speed finish milling | High speed, low depth | Maximum cooling | 4-6 | Surface finish, dimensional accuracy |
Finish turning | High speed, low feed | Cooling + moderate lubrication | 5-7 | Surface roughness, tool life |
Rough milling | Medium speed, high depth | Balanced cooling + lubrication | 6-8 | Tool life, metal removal rate |
Rough turning | Medium speed, high feed | Balanced | 6-8 | Tool life, chip control |
Standard drilling | Medium speed | Balanced + chip evacuation | 6-8 | Tool life, hole quality |
Deep hole drilling | Low speed, high depth | Chip evacuation + cooling | 5-7 | Chip clearance, tool life |
Tapping | Low speed, high pressure | Maximum EP lubrication | 8-12 | Tap life, thread quality |
Threading (single point) | Low speed, high pressure | EP lubrication | 8-10 | Tool life, thread finish |
Broaching | Very low speed, very high pressure | Maximum EP lubrication | 10-12 | Tool life, surface quality |
Gear cutting | Low speed, high pressure | EP lubrication + cooling | 8-10 | Tool life, gear tooth finish |
A shop running all operations at a fixed 8 percent is over-concentrating for finishing (wasting fluid and reducing cooling) and under-concentrating for tapping and broaching (shortening tool life and risking quality defects).
Figure 3. Operation-Concentration Optimization Impact
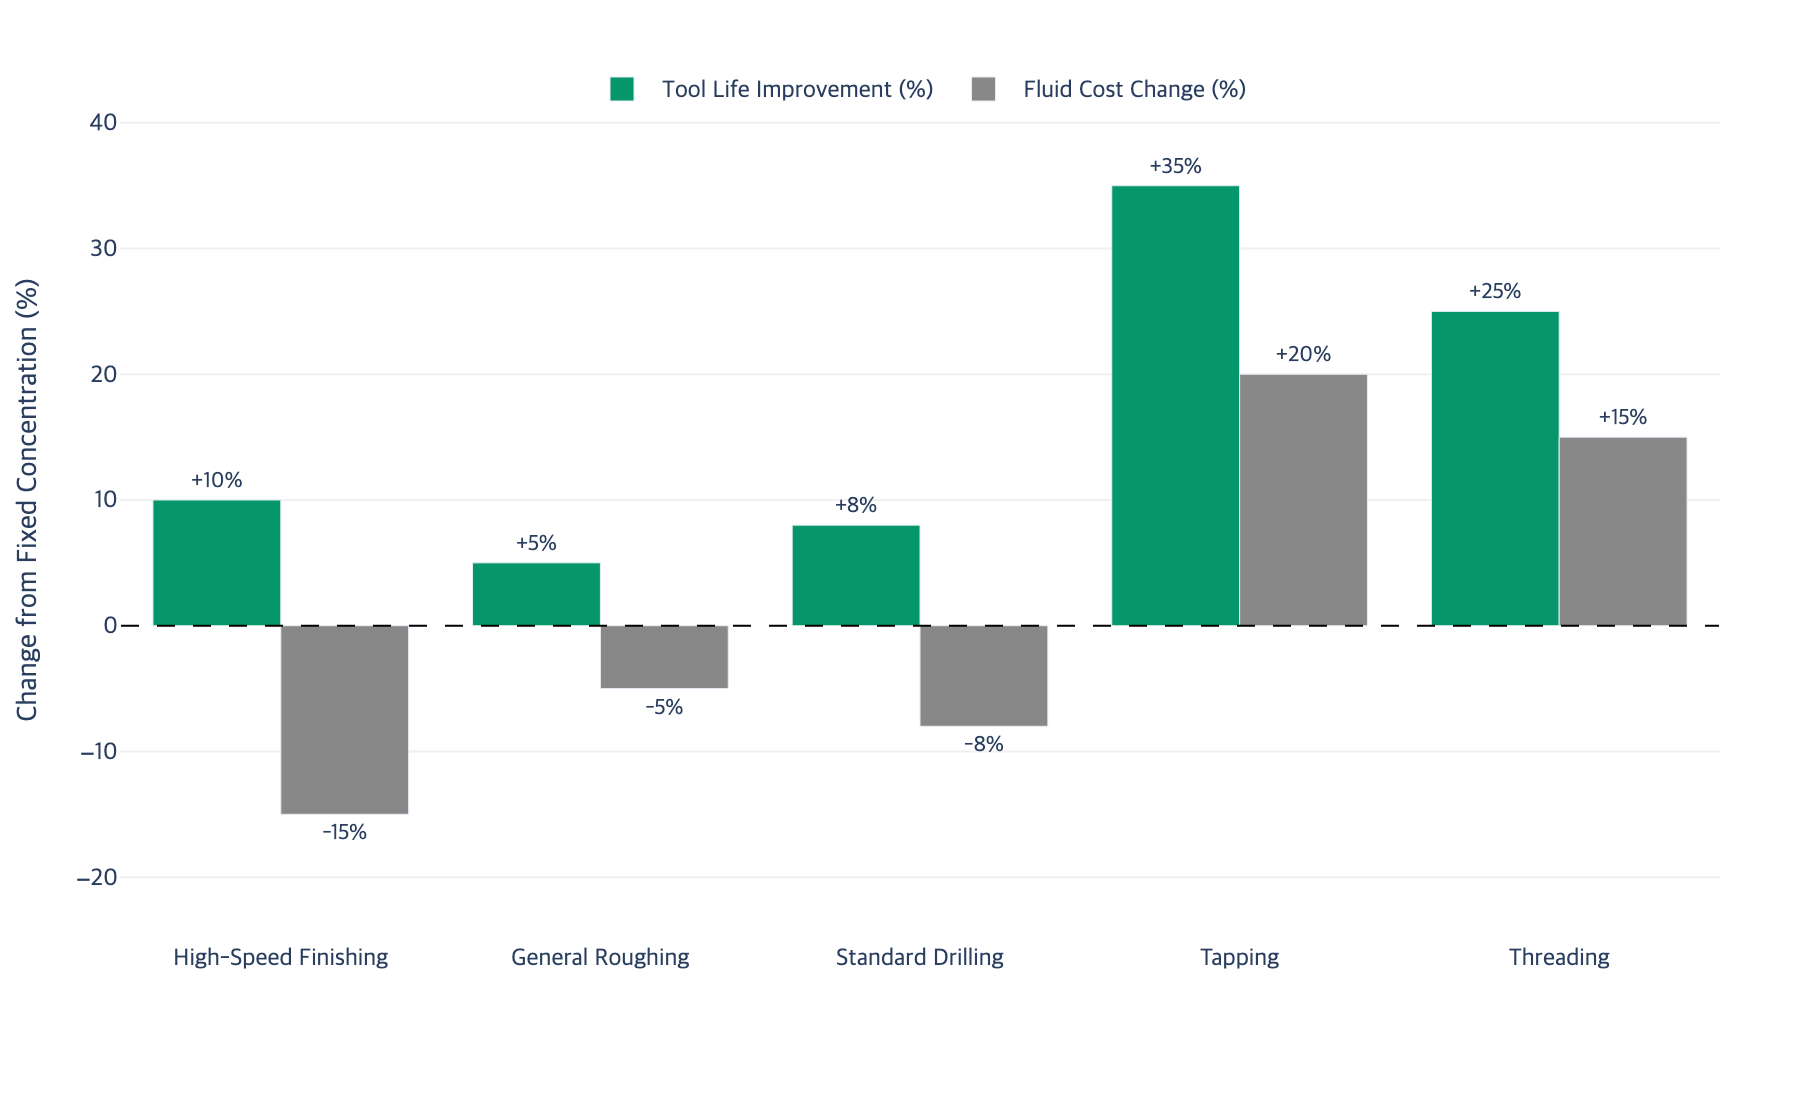
Finishing operations gain cooling performance (5 to 10 percent tool life improvement) while consuming less concentrate. Tapping and threading operations gain EP performance (20 to 40 percent tool life improvement) at a modest fluid cost increase that is far exceeded by tool cost savings.
IV. Implementation: Adjusting Concentration in Practice
Implementing operation-specific concentration requires practical methods for adjusting and monitoring without adding excessive labor or complexity.
Centralized System Approach
Facilities with centralized fluid systems face the constraint that all machines receive the same concentration. Set the system concentration to the most demanding operation (typically 8 to 10 percent) and use supplemental application for operations that would benefit from different levels. Some facilities install secondary mixing units at individual machines that dilute the centralized supply for finishing operations, though this adds complexity.
Individual Sump Approach
Machines with individual sumps offer the most flexibility. Group machines by operation type and set concentration targets for each group: finishing at 5 to 6 percent, tapping or threading at 9 to 11 percent, general-purpose at 7 to 8 percent. For machines that perform multiple operation types, set concentration to favor the most critical operation. If a machine alternates between roughing and tapping, lean toward the tapping requirement (8 to 10 percent) because the cost consequence of inadequate EP performance far exceeds the modest cooling penalty during roughing.
Concentration Monitoring
Refractometer readings are the standard method for monitoring concentration. The refractometer measures the refractive index of the emulsion, which correlates to concentration through a product-specific calibration factor. Best practice is to measure once or twice per day, with additional checks after weekend shutdowns when evaporation may have concentrated the fluid significantly (Master Fluids, 2025).
Concentration drift occurs through evaporation (concentration increases), dragout (concentration decreases as fluid is carried away on parts), and contamination (tramp oil skews the reading). When making adjustments, always add pre-mixed emulsion at the target concentration rather than adding straight water or straight concentrate, which can destabilize the emulsion.
Refractometer Calibration and Accuracy
Each fluid product has a specific refractometer factor that converts the Brix reading to actual concentration. Using the wrong factor can result in systematic errors of 1 to 2 percentage points, enough to negate the benefits of operation-specific targeting. Verify the refractometer factor with your fluid supplier and recalibrate the instrument with distilled water before each measurement session. Tramp oil contamination can also skew readings upward, so pair refractometer measurements with periodic titration checks to confirm accuracy (MISCO, 2024).
Figure 4. Concentration Impact on Key Performance Metrics
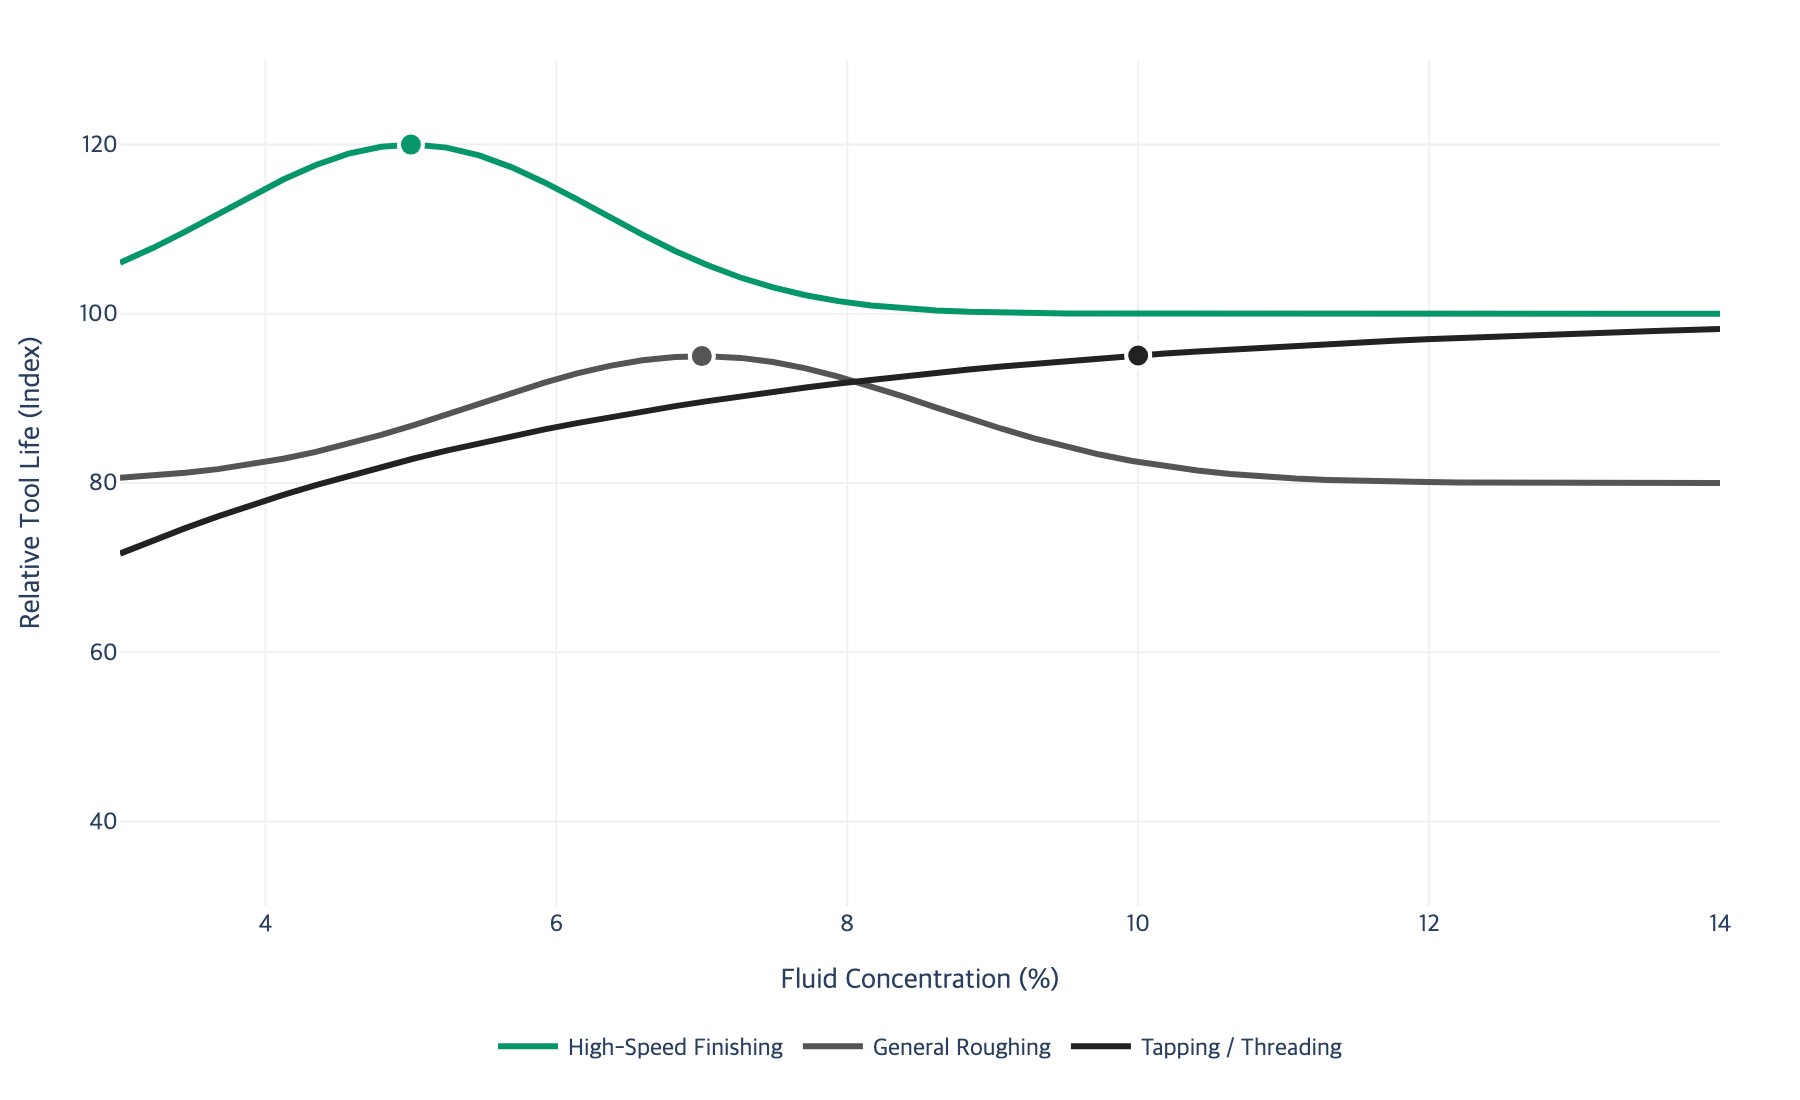
Finishing operations show optimal tool life at lower concentrations (peaking around 5 to 6 percent), while tapping operations show tool life increasing steadily up to 10 to 12 percent. No single concentration maximizes tool life across all operation types.
V. Concentration Drift, Biological Stability, and Common Pitfalls
Sustaining concentration optimization over weeks and months requires attention to drift patterns, biological stability, and the common mistakes that erode performance gains.
Evaporation and Seasonal Drift
Evaporation is the dominant cause of concentration drift. As water evaporates from the sump, concentration increases. In summer months or facilities without climate control, concentration can drift upward by 1 to 2 percentage points per week. For machines targeting 5 percent for finishing, this drift can push the sump to 7 percent within two weeks, eliminating the cooling advantage. Increase monitoring frequency during warm months. Machines with small sumps (50 to 100 liters) drift faster than large sumps (500 liters or more) and may require daily adjustment during summer.
Biological Stability at Low Concentrations
Lower concentrations reduce the effective dose of biocides and biostatic agents in the fluid, increasing susceptibility to microbial contamination. A healthy emulsion should maintain pH between 8.6 and 9.0. When bacterial contamination takes hold, pH drops, creating a feedback loop where lower pH accelerates further proliferation (HSE, 2024).
For sumps running at 4 to 6 percent, monitor pH weekly using dip-slide tests. Bacterial counts below 10,000 CFU/ml indicate good control. Counts between 10,000 and 1,000,000 CFU/ml require corrective action such as biocide addition. Counts above 1,000,000 CFU/ml typically require a sump dump and recharge (HSE, 2024). Good sump hygiene, including tramp oil removal and chip clearing, reduces biological risk at all concentration levels.
Common Implementation Pitfalls
Three recurring mistakes undermine concentration optimization. First, inconsistent measurement technique: if different operators read the refractometer differently or fail to clean the prism, recorded concentrations become unreliable. Standardize the procedure and designate a single measurement location on each sump.
Second, neglecting dragout losses. High-volume production can drag out significant fluid volumes per shift. If top-up fluid is mixed at a different concentration than the sump target, each addition shifts concentration in an unintended direction. Pre-mix top-up fluid at the exact target concentration for each machine group.
Third, abandoning the system after personnel changes. Document the concentration targets and reasons behind each target. Post targets visibly at each machine so the system survives personnel transitions.
VI. Tracking and Quantifying the Cost Benefit
Quantifying the cost benefit of concentration optimization requires tracking both fluid consumption and tool consumption before and after implementation. Without data, the motivation to maintain differentiated concentrations erodes over time.
Fluid Consumption Tracking
Record concentrate usage (liters per week or per month) by machine or machine group. Machines running at lower concentration will show reduced consumption; machines at higher concentration will show increased consumption. Most shops achieve 10 to 20 percent net reduction because finishing and general machining operations, which consume the majority of fluid, run at lower concentrations.
Tool Life Tracking
Record tool changes by operation type, including the reason for change (wear, breakage, quality). Expect tool life improvements of 5 to 15 percent for finishing (better cooling) and 15 to 40 percent for tapping and threading (better EP performance). Convert improvements to cost savings using actual tool costs. Tap consumption tracking produces the most convincing data because taps are expensive and the improvement is typically the most dramatic.
Net Cost-Benefit Calculation
Calculate the total savings as: (tool cost reduction) + (fluid cost reduction) minus (monitoring labor cost). For a typical job shop with annual tool costs of USD 80,000 and fluid costs of USD 15,000, a 20 percent tool life improvement (USD 16,000) combined with 15 percent fluid cost reduction (USD 2,250) minus monitoring labor (USD 1,500) yields net annual benefit of approximately USD 16,750.
Return on Investment Timeline
The investment is minimal: refractometers (USD 200 to USD 500 each), training (2 to 4 hours), and management time to set up tracking. Most shops achieve full return within the first month.
Figure 5. Cost-Benefit Breakdown by Operation Category
Operation Category | Tool Life Change | Fluid Cost Change | Net Annual Impact (Typical) |
|---|---|---|---|
High-speed finishing | +5 to 10% | -15 to 25% (lower concentration) | USD 2,000 to 4,000 savings |
General roughing | +5 to 10% | -5 to 10% (slight reduction) | USD 3,000 to 6,000 savings |
Tapping and threading | +20 to 40% | +10 to 20% (higher concentration) | USD 5,000 to 10,000 savings |
Broaching and gear cutting | +15 to 30% | +15 to 25% (higher concentration) | USD 2,000 to 5,000 savings |
Tapping and threading operations generate the largest net savings despite increased fluid cost, because the tool cost reduction far exceeds the additional concentrate expense.
VII. Key Takeaway
Running all machining operations at a single fixed concentration compromises both performance (tool life, surface finish) and cost (fluid consumption).
Finishing operations benefit from lower concentration (4 to 6 percent) for maximum cooling capacity, while tapping and threading operations benefit from higher concentration (8 to 12 percent) for maximum EP lubrication.
Operation-matched concentration management can simultaneously extend tool life by 15 to 30 percent and reduce fluid consumption by 10 to 20 percent.
Daily refractometer monitoring (less than one minute per sump) provides the data needed to maintain optimal concentration targets for each operation type. Pair with weekly pH checks for sumps running below 6 percent concentration to catch biological stability issues early.
Tool cost savings from concentration optimization typically exceed fluid cost savings by a factor of 5 to 10x, making this one of the highest-return process improvements available in a machining operation.
Lubinpla's process optimization module can cross-reference your fluid chemistry, machining parameters, and tool wear patterns to generate operation-specific concentration targets for your facility. Upload your refractometer logs and tool change records, and the platform returns a concentration management plan with projected savings based on your actual operating data.
VIII. References
[1] MSC Direct, "Cutting Fluids Guide: Types, Uses and Tips", 2024. https://www.mscdirect.com/resources/buying-guides/metalworking-fluids
[2] Impact Fluids, "Metalworking Fluid Optimization Guide", 2024. https://www.impactfluidsinc.com/metalworking-fluid-optimization-guide/
[3] ChemCeed, "Formulation 101: How to Formulate a Basic Metalworking Fluid", 2024. https://chemceed.com/product-news/formulation-101-how-to-formulate-a-basic-metalworking-fluid/
[4] TMT Toolbox, "The Effect of Cutting Fluids on Tool Life and Surface Finish", 2024. https://tmttoolbox.com/the-effect-of-cutting-fluids-on-tool-life-and-surface-finish/
[5] Canadian Metalworking, "Enhance Surface Finish with High-Speed Machining", 2024. https://www.canadianmetalworking.com/canadianmetalworking/article/metalworking/enhance-surface-finish-with-high-speed-machining
[6] ScienceDirect, "Metalworking Fluid Overview", 2024. https://www.sciencedirect.com/topics/engineering/metalworking-fluid
[7] Machinery Lubrication, "Metalworking Fluid Management Best Practices", 2024. https://www.machinerylubrication.com/Read/28619/metalworking-fluid-practices
[8] Master Fluid Solutions, "Mastering the Basics: How to Extend the Life of Your Metalworking Fluids", 2025. https://www.masterfluids.com/blog/2025/02/20/mastering-the-basics-how-to-extend-the-life-of-your-metalworking-fluids/
[9] Q8 Oils, "Reduce Your Machining Costs with Metalworking Fluid Management", 2024. https://www.q8oils.com/metalworking/machiningcosts-part1/
[10] Production Machining, "Metalworking Fluid Management and Best Practices", 2024. https://www.productionmachining.com/articles/metalworking-fluid-management-and-best-bractices
[11] Springer, "Investigating the Industrial Impact of Hydraulic Oil Contamination on Tool Wear During Machining", 2020. https://link.springer.com/article/10.1007/s00170-020-06370-y
[12] HSE, "Bacterial Contamination of Metalworking Fluids", 2024. https://www.hse.gov.uk/metalworking/bacterial.htm
[13] MISCO, "Refractometer for Testing Metalworking Fluids and Coolant", 2024. https://www.misco.com/refractometer-applications/metalworking-refractometer/
Powered by Lubinpla
Discover how technical teams solve complex challenges faster with AI.