What Wear Patterns Tell You About Lubricant Selection: Connecting Debris Analysis to Product Decisions
Summary: Wear debris analysis is widely used for condition monitoring, but its greatest value lies in informing lubricant product decisions rather than just maintenance timing. Different wear debris types, including cutting, sliding, fatigue, corrosive, and spherical particles, each indicate specific lubrication deficiencies such as boundary film failure, viscosity mismatch, or additive depletion. This article connects wear mechanism classification to lubricant chemistry gaps and provides a practical guide for translating observed wear patterns into targeted product changes. When debris analysis drives lubricant reselection rather than just schedule adjustments, the root cause of wear can be eliminated entirely.
Table of Contents
I. Why Wear Debris Analysis Should Drive Product Decisions
II. Wear Debris Classification and What Each Type Reveals
III. Connecting Wear Mechanisms to Lubricant Chemistry Gaps
IV. The Diagnostic Framework: From Debris to Product Action
V. Field Cases: Debris-Driven Lubricant Reselection
VI. Common Mistakes When Interpreting Wear Data
VII. Key Takeaway
VIII. References
I. Why Wear Debris Analysis Should Drive Product Decisions
An equipment reliability team receives monthly oil analysis reports showing elevated iron particle counts in a gearbox. Each month, they shorten the oil change interval slightly, hoping to keep wear metals below alarm thresholds. After six months of increasingly frequent oil changes, the iron counts continue rising. The lubricant is not the problem in quantity or freshness. The lubricant is the wrong product for the application.
This pattern repeats across industrial facilities worldwide. Approximately 43 percent of industrial equipment mechanical failures originate from lubrication-related issues (Machinery Lubrication, 2022). Yet most oil analysis programs focus on condition monitoring, using wear metal trends to schedule maintenance actions, rather than questioning whether the current lubricant is correctly matched to the operating conditions. The distinction matters enormously. Condition monitoring treats wear as inevitable and manages its progression. Lubricant reselection based on wear mechanism analysis can eliminate the wear source entirely.
The gap between these two approaches is not a knowledge gap. It is a workflow gap. Oil analysis laboratories report particle counts, wear metal concentrations, and viscosity changes. Maintenance teams compare values against alarm thresholds. When values exceed thresholds, the standard response is to schedule maintenance or shorten oil change intervals. The question "Is this the right lubricant?" rarely appears in routine oil analysis workflows.
Wear debris carries detailed information about how and why material is being removed from machine surfaces. The morphology, size, color, and composition of wear particles reveal the specific wear mechanism at work. Each mechanism maps to a specific lubrication deficiency, and each deficiency points to a specific product parameter that needs correction. This diagnostic chain, from debris type to wear mechanism to chemistry gap to product change, is the core framework this article presents.
II. Wear Debris Classification and What Each Type Reveals
Analytical ferrography separates wear particles from lubricating oil using a magnetic field and examines them under microscopy to identify morphology, size, composition, and surface condition (Fluid Life, 2024). The ferrogram slide arranges particles by size, with larger particles depositing near the magnet entry point and smaller particles traveling further along the slide. Six primary wear debris types provide diagnostic information about the wear mechanism at work.
Cutting Wear Particles
Cutting wear particles appear as elongated spirals or curled ribbons, similar to machining swarf, typically ranging from 2 to 50 micrometers. The spiral shape forms when a hard particle or surface asperity plows through a softer bearing surface, displacing material in a continuous chip rather than a flat flake.
Cutting wear indicates one of two conditions: abrasive contamination (external particles acting as third-body abrasives) or insufficient EP additive protection (direct metal contact creating plowing asperities). Distinguishing between these requires examining particle composition. If the particles match the bearing alloy, EP additive deficiency is likely. If foreign materials such as silicon are present, contamination is the driver (Machinery Lubrication, 2024).
Sliding Wear Particles
Sliding wear generates flat, platelike particles with smooth surfaces, typically 2 to 15 micrometers during normal operation. These form when the hydrodynamic film is breached and metal-to-metal contact occurs under sliding motion. The alarm triggers when particles exceed 15 micrometers in size or increase significantly in concentration.
Sliding wear directly indicates viscosity mismatch: the lubricant viscosity is too low for the operating speed and load, failing to maintain fluid film separation (AZoM, 2024). In gear systems, this often manifests when actual operating temperatures exceed the original design specification, a common scenario after production throughput increases.
Fatigue Wear Particles
Fatigue particles appear as chunky, irregularly shaped pieces with rough, pitted surfaces, ranging from 10 to 100 micrometers. They result from subsurface crack propagation under repeated cyclic loading, most common in rolling element bearings and gear tooth flanks.
Fatigue wear suggests insufficient elastohydrodynamic (EHD) film formation, where contact pressure exceeds what the fluid film can support. EP and anti-wear (AW) additive levels may also be insufficient for transient overloads during startup, load changes, or shock events.
Corrosive Wear Particles
Corrosive wear produces small particles (1 to 10 micrometers) with rough, etched surfaces and distinctive coloration such as red or black iron oxides. Unlike mechanical wear, corrosive wear occurs through chemical dissolution of the metal surface followed by removal of the weakened layer during rubbing contact (Spectro Scientific, 2024).
Corrosive debris indicates chemical attack from acidic degradation products, moisture contamination, or incompatible additive chemistry. Even 0.1 percent water content in a circulating oil system can accelerate oxidation and acid formation. This makes moisture control as important as lubricant selection in preventing corrosive wear.
Spherical Particles
Spherical particles are smooth and round, typically less than 3 micrometers in diameter. In rolling bearing applications, they indicate fatigue crack propagation where material is expelled from developing spall craters. Their presence often predates larger fatigue chunks by weeks or months, making them a valuable early warning indicator. They suggest the lubricant viscosity may be too low for the bearing speed factor (DN value).
Laminar Wear Particles
Laminar particles are thin, flat, and large (20 to 100 micrometers), with thickness typically one-tenth to one-thirtieth of their lateral dimension (Spectro Scientific, 2024). They represent a secondary wear mode where earlier debris forced through the load zone damages surfaces and creates large "rolled out" particles. Laminar particles signal severe, prolonged film compromise.
Figure 1. Wear Debris Type Summary and Lubricant Implications
Debris Type | Morphology | Size Range | Wear Mechanism | Primary Lubricant Gap |
|---|---|---|---|---|
Cutting | Spiral, ribbon-like | 2-50 um | Abrasive plowing | EP additive deficiency, contamination |
Sliding | Flat, platelike | 2-15 um (normal) | Film breach | Viscosity too low for load/speed |
Fatigue | Chunky, rough surface | 10-100 um | Subsurface cracking | Viscosity too low, AW/EP insufficient |
Corrosive | Irregular, etched | 1-10 um | Chemical attack | Base oil incompatibility, moisture |
Spherical | Smooth, round | Less than 3 um | Fatigue crack | Viscosity below DN requirement |
Laminar | Thin, flat, large | 20-100 um | Severe sliding | Severe viscosity mismatch |
Figure 2. Distribution of Wear Debris Types in Typical Industrial Gearbox
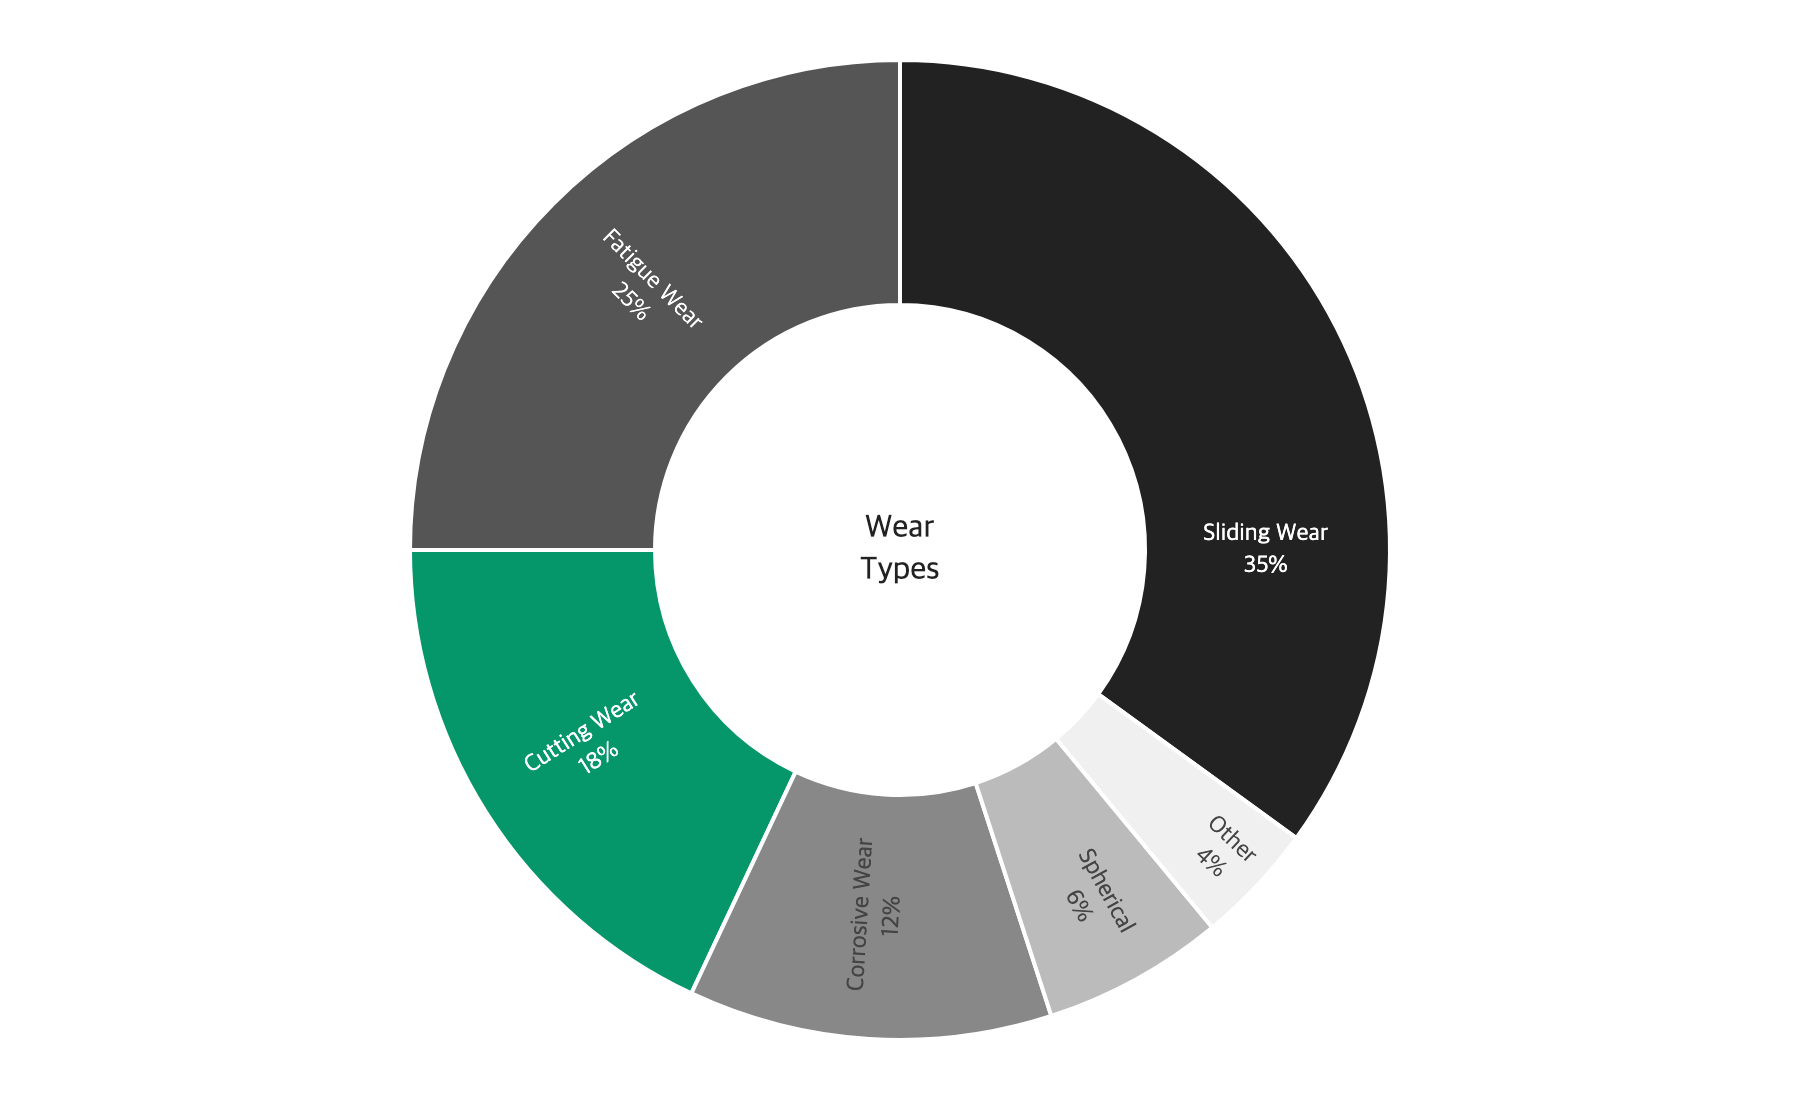
Each debris type maps to a specific lubrication deficiency. The diagnostic value is not in identifying that wear is occurring, which trending already reveals, but in identifying why it is occurring and what product parameter change will address the root cause. A facility running routine oil analysis that reports only particle counts and wear metal PPM is capturing the "what" but missing the "why." Adding analytical ferrography to the program, even on an exception basis when wear metals trend upward, captures the morphological data needed to drive product decisions.
III. Connecting Wear Mechanisms to Lubricant Chemistry Gaps
The transition from wear mechanism identification to lubricant product action requires understanding which lubricant properties prevent each wear mode. Three primary characteristics control the majority of wear prevention: viscosity, additive chemistry, and base oil type.
Viscosity: The Primary Film-Forming Property
Viscosity determines the lubricant's ability to maintain a separating film between moving surfaces. The viscosity ratio (kappa) compares actual operating viscosity to the minimum required for full film lubrication per ISO 281:2007 (Tribonet, 2024). A kappa below 1.0 indicates boundary lubrication where metal-to-metal contact is expected. Values between 1.0 and 4.0 indicate mixed film lubrication. A kappa above 4.0 indicates full hydrodynamic separation.
When sliding or fatigue debris appears, calculating kappa often reveals the lubricant is operating below 1.0 at actual temperature (Machinery Lubrication, 2022). This is common in uprated equipment where the OEM viscosity recommendation was calculated for an original operating temperature 10 to 20 degrees lower than current conditions. Every 10 degrees Celsius increase reduces mineral oil viscosity by approximately 50 percent, which can shift kappa from adequate to severely deficient.
EP and Anti-Wear Additives: Boundary Protection
EP additives (sulfur-phosphorus compounds) activate at high temperatures from metal-to-metal contact, forming protective iron sulfide and iron phosphate films through tribochemical reactions (Machinery Lubrication, 2024). These sacrificial films allow controlled micro-shearing rather than welding. The FZG gear test measures EP performance, with industrial gear oils requiring minimum FZG stage 11.
AW additives, most commonly ZDDP, form phosphate glass-based tribofilms at lower temperatures and pressures. ZDDP tribofilm growth is stress-activated and increases exponentially with temperature (Zhang and Spikes, 2016). These films evolve from soft, long-chain polyphosphates to more wear-resistant short-chain phosphates during operation.
Cutting wear without contamination often indicates insufficient EP levels. Fatigue debris despite adequate kappa values suggests insufficient AW protection against transient overloads. In both cases, the corrective action is selecting a formulation with enhanced additive concentration.
Base Oil Type and Corrosion Protection
The base oil comprises 80 to 95 percent of the finished lubricant. Group I mineral oils (viscosity index 90-105) are most susceptible to oxidation. Group III hydrocracked oils reach viscosity indices above 120. Group IV PAO synthetics offer viscosity indices of 125 to 200 and superior oxidation stability (Machinery Lubrication, 2024). The practical significance: a PAO maintains adequate kappa values across wider temperature ranges than a mineral oil of the same ISO VG grade.
Corrosive wear indicates chemistry mismatch. Three scenarios produce corrosive debris: base oil oxidation producing acids (measured by TAN), active sulfur EP additives attacking copper alloy components, and inadequate corrosion inhibitors for moisture levels present. Acidic degradation requires a more oxidation-resistant base oil. Moisture-driven corrosion requires improved sealing or enhanced water separation chemistry.
IV. The Diagnostic Framework: From Debris to Product Action
The following framework provides a systematic path from wear observation to lubricant product decision.
Step 1 is classifying the dominant wear type from ferrography based on particle morphology, size, and concentration relative to equipment baseline. Step 2 is mapping the dominant type to the corresponding lubricant deficiency. Step 3 is evaluating the current product against the identified gap by checking ISO VG grade, EP/AW levels, base oil type, and calculating the kappa ratio at measured operating temperature. Step 4 is selecting the corrective product that addresses the specific deficiency without over-specifying other parameters.
Figure 3. Wear-to-Lubricant Action Decision Matrix
Observed Wear | Root Cause | Lubricant Action | Specification to Check |
|---|---|---|---|
Sliding (platelike) | Viscosity too low | Increase VG grade or switch to higher VI base oil | ISO VG at operating temp |
Cutting (spiral) | EP additive deficiency | Select higher EP formulation | 4-ball weld load, FZG |
Cutting (spiral) | Abrasive contamination | Improve filtration, not lubricant change | Particle count, ISO cleanliness |
Fatigue (chunky) | Film thickness insufficient | Higher viscosity or enhanced AW | Kappa ratio calculation |
Fatigue (chunky) | Transient overloads | Enhanced EP/AW package | FZG stage, 4-ball wear scar |
Corrosive (etched) | Oxidation or incompatibility | Synthetic base oil or enhanced inhibitors | TAN, oxidation stability |
Corrosive (etched) | Moisture contamination | Water separation chemistry, improved sealing | Water content, demulsibility |
Spherical (smooth) | Rolling contact fatigue | Higher viscosity for DN value | Minimum film thickness |
Laminar (thin, large) | Severe prolonged sliding | Viscosity upgrade plus synthetic conversion | Kappa ratio, VI comparison |
Not every wear problem requires a lubricant change. When the debris pattern points to contamination, filtration is the answer. But when it points to a chemistry gap, only a product change will resolve the root cause. Shortened oil change intervals do not change the film thickness, additive chemistry, or oxidation resistance of the lubricant in the machine at any given moment.
V. Field Cases: Debris-Driven Lubricant Reselection
The following cases illustrate how debris-driven product decisions deliver results that schedule-based adjustments cannot.
Case 1: Gearbox Sliding Wear Resolved by Viscosity Upgrade
Company A operates a heavy-duty industrial gearbox driving a conveyor system in a cement plant. Oil analysis over 8 months showed iron rising from 35 to 120 ppm and chromium from 8 to 28 ppm. The maintenance team shortened oil change intervals from 6 months to 3 months, then to 6 weeks, with no improvement.
Analytical ferrography revealed flat, platelike sliding wear debris in the 15 to 40 micrometer range. The gearbox used ISO VG 220 mineral oil per OEM specification, but operating temperature had increased from the design value of 65 degrees Celsius to 82 degrees Celsius due to higher throughput. At 82 degrees, the oil's actual viscosity was 28 cSt against a minimum requirement of 42 cSt, yielding a kappa ratio of 0.67.
The corrective action was switching to ISO VG 320 synthetic PAO gear oil, providing 45 cSt at 82 degrees (kappa 1.07). Within 3 months, iron dropped from 120 to 22 ppm and chromium from 28 to 5 ppm. The oil change interval extended to 12 months, reducing annual lubricant cost by 40 percent despite the higher per-liter price. Total annual maintenance savings were approximately USD 18,000.
Case 2: Bearing Fatigue Wear Addressed by EP Additive Enhancement
Company B operates a rolling mill with large-diameter roller bearings supporting heavy steel slabs at up to 90 degrees Celsius. Ferrography identified spherical particles below 3 micrometers alongside chunky fatigue debris in the 20 to 50 micrometer range. Bearing replacement averaged 14 months against a 36-month design life.
The ISO VG 460 mineral oil had adequate viscosity (kappa 1.3) at operating temperature, ruling out film thickness as the cause. However, transient shock loads during slab entry (0.5 to 2 second events) exceeded the standard AW additive package's load-carrying capacity.
Switching to an ISO VG 460 formulation with enhanced EP/AW (higher ZDDP plus sulfur-phosphorus EP additives, FZG stage 12+, 4-ball weld load 400 kg vs. previous 250 kg) extended bearing life from 14 to 32 months. Annual bearing costs dropped from USD 86,000 to USD 38,000 (55.8 percent reduction) against a USD 2,400 lubricant cost increase. Net annual savings: USD 45,600.
Case 3: Corrosive Wear Traced to Moisture and Base Oil Degradation
Company C operates a hydraulic press system using ISO VG 46 Group I mineral oil. After a cooling water line was routed near the hydraulic reservoir, TAN rose from 0.8 to 2.4 mg KOH/g over 10 months. Copper climbed from 3 to 45 ppm and iron from 12 to 58 ppm.
Ferrography revealed corrosive particles with etched surfaces: red-brown on iron particles, green-black on copper (from bronze pump bushings). Water content measured 0.18 percent against a 0.05 percent maximum. Condensation from the cooling line had overwhelmed the Group I oil's oxidation resistance.
The corrective action combined source control (insulating the water line, installing a desiccant breather) with a lubricant change to Group III hydrocracked base oil with enhanced rust/oxidation inhibitors and demulsibility. Within 4 months, TAN stabilized at 0.6, copper dropped to 6 ppm, and iron to 15 ppm. Pump rebuild intervals returned from 18 months to the 48-month design life.
Figure 4. Before vs After Lubricant Reselection: Key Metrics Comparison
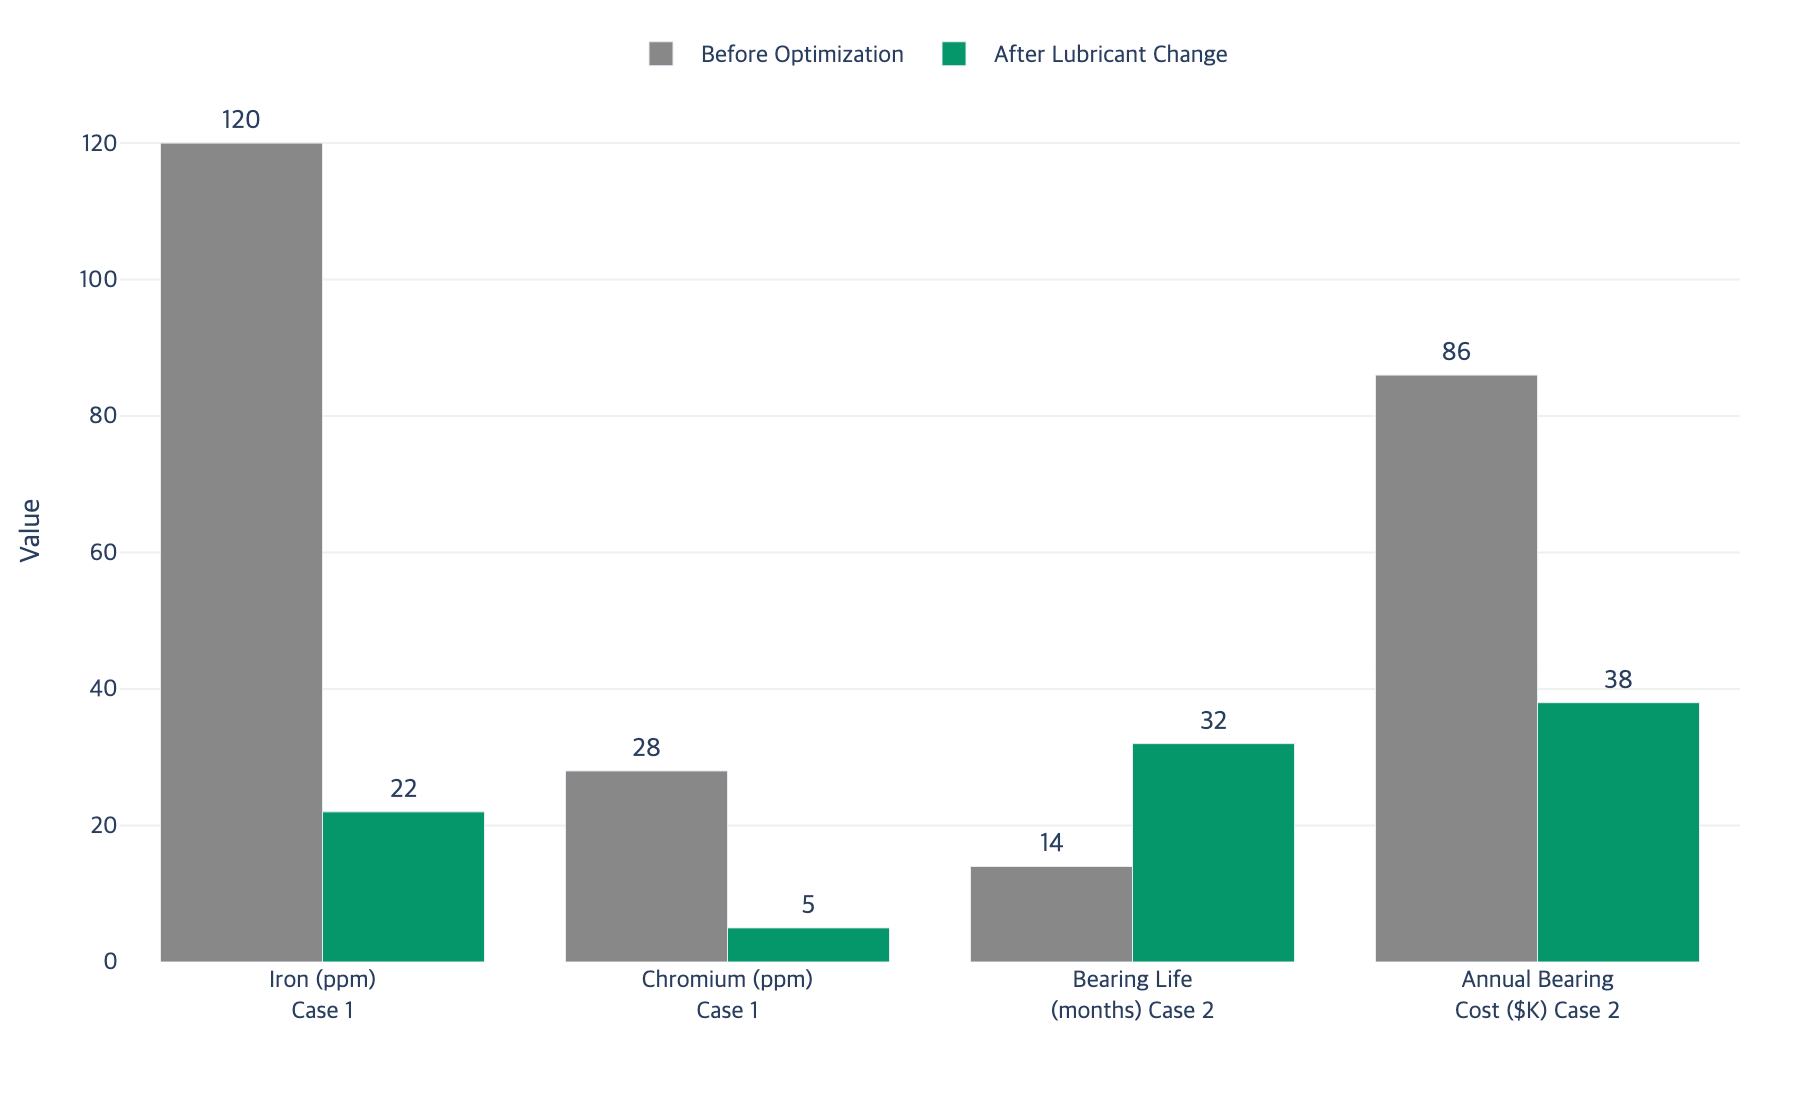
All three cases demonstrate that targeted lubricant reselection based on wear debris analysis delivers dramatic improvements in equipment life and operating cost. The improvements represent fundamental elimination of the wear root cause, not incremental gains. In each case, the debris morphology pointed to a specific lubricant deficiency, the diagnostic framework identified the corrective action, and the product change resolved the issue at its source.
VI. Common Mistakes When Interpreting Wear Data
Field teams frequently make interpretation errors that lead to incorrect product decisions. Recognizing these common mistakes avoids costly misdiagnosis.
Treating All Elevated Wear Metals as a Single Problem
When iron, chromium, and copper all rise simultaneously, the instinct is to assume a single cause. In practice, different metals originate from different components and may indicate different wear mechanisms. Iron from gear teeth may indicate sliding wear while copper from thrust washers may indicate corrosive attack. Analytical ferrography separates these by morphology, enabling independent corrective actions.
Ignoring Temperature as a Variable
OEM lubricant recommendations assume design operating temperatures. When equipment is uprated, a lubricant providing kappa 1.5 at 60 degrees Celsius may drop to kappa 0.6 at the actual 85 degrees Celsius. Every kappa calculation must use the measured steady-state operating temperature.
Confusing Contamination Wear with Lubricant Deficiency
Cutting wear from contamination requires filtration. Cutting wear from EP deficiency requires a product change. Particle composition analysis during ferrography distinguishes these causes: particles matching machine alloys indicate EP issues, while foreign material like silica indicates contamination.
Overlooking Additive Depletion
ZDDP and EP additives are consumed during operation. As concentration depletes, tribofilm replenishment slows until protection becomes insufficient. This produces debris patterns identical to "wrong product" when the issue is "correct product, depleted." Monitoring additive element concentrations alongside wear metals distinguishes between these scenarios.
VII. Key Takeaway
Wear debris analysis is most valuable when it drives lubricant product decisions, not just maintenance scheduling
Each debris type maps to a specific deficiency: sliding to viscosity, cutting to EP/contamination, corrosive to chemistry, fatigue to film thickness or AW protection
Calculate kappa at actual operating temperature, not design temperature
When wear patterns indicate a chemistry gap, only a product change resolves the root cause
Use the wear-to-lubricant action matrix to connect debris patterns to product specification changes
Verify particle composition to distinguish contamination-driven from additive-deficiency-driven cutting wear
Lubinpla's AI assistant can cross-reference your wear debris analysis results with operating conditions, actual temperature data, and lubricant specifications to identify whether the observed wear pattern indicates a product mismatch. It calculates kappa ratios, maps debris morphology to chemistry gaps, and recommends specific lubricant parameter changes for root cause resolution, replacing the manual diagnostic chain with a systematic, data-driven product decision workflow.
VIII. References
[1] Machinery Lubrication, "Common Lubrication Misconceptions", 2022. https://www.machinerylubrication.com/Read/30589/common-lubrication-misconceptions
[2] Machinery Lubrication, "Anatomy of Wear Debris", 2024. https://www.machinerylubrication.com/Read/29537/wear-debris-anatomy
[3] Machinery Lubrication, "Condition Monitoring and Predictive Analysis by Wear Debris", 2024. https://www.machinerylubrication.com/Read/717/condition-monitoring-predictive-analysis-of-tribosystems-by-wear-debris
[4] Fluid Life, "Analytical Ferrography", 2024. https://www.fluidlife.com/resource-center/analytical-ferrography/
[5] AZoM, "How to Analyze Sliding and Fatigue Wear Debris", 2024. https://www.azom.com/article.aspx?ArticleID=23825
[6] Spectro Scientific, "Severe Sliding and Fatigue Wear Debris Analysis", 2024. https://www.spectrosci.com/knowledge-center/blogs/product-technologies/severe-sliding-and-fatigue-wear-debris-analysis-for-machinery-components
[7] Spectro Scientific, "Analysis of Large Wear Debris is Essential for Comprehensive Oil Analysis", 2024. https://www.spectrosci.com/knowledge-center/blogs/oil-analysis/analysis-of-large-wear-debris-is-essential-for-comprehensive-oil-analysis
[8] Chevron Lubricants, "Interpreting Oil Analysis", 2024. https://www.chevronlubricants.com/en_us/home/learning/from-chevron/industrial-machinery/interpreting-oil-analysis.html
[9] AMSOIL Industrial, "Diagnose Your Machinery with Analytical Ferrography", 2024. https://blog.amsoilindustrial.com/2024/03/08/diagnose-your-machinery-with-analytical-ferrography/
[10] Tribonet, "How to Determine Optimal Base Oil Viscosity Using the ISO 281 Kappa Factor", 2024. https://www.tribonet.org/news/general-topics/how-to-determine-optimal-base-oil-viscosity-for-rolling-bearings-using-the-iso-281-kappa-factor/
[11] Machinery Lubrication, "Analytical Ferrography - Make It Work For You", 2024. https://www.machinerylubrication.com/Read/5/analytical-ferrography
[12] ALS Global, "Interpreting Oil Analysis Results", 2025. https://www.alsglobal.com/en/news-and-publications/2025/02/interpreting-your-oil-analysis-results
[13] Machinery Lubrication, "Base Oil Groups Explained", 2024. https://www.machinerylubrication.com/Read/29113/base-oil-groups
[14] Zhang and Spikes, "On the Mechanism of ZDDP Antiwear Film Formation", Tribology Letters, 2016. https://link.springer.com/article/10.1007/s11249-016-0706-7
[15] Machinery Lubrication, "The Role of Extreme Pressure Additives in Gear Oil", 2024. https://www.machinerylubrication.com/Read/28470/role-of-extreme-pressure-additives-in-gear-oil-
Powered by Lubinpla
Discover how technical teams solve complex challenges faster with AI.