Electroplating Bath Drift and the Control Limits That Predict Rejects
Summary: Reject spikes in electroplating lines are rarely sudden events. This article demonstrates that bath chemistry drift (particularly pH shift, brightener depletion, metal ion concentration variance, and temperature fluctuation) generates measurable leading indicators up to four days before a reject spike surfaces at inspection. The article presents the scientific basis for each drift variable, quantifies how far ahead each variable predicts yield loss, compares the cost of reactive versus predictive bath adjustment programs, and delivers a field-ready control plan with sampling frequency, action limits, and adjustment sequencing. Two field cases from job shop and OEM plating environments illustrate the control plan in practice, with quantitative before-and-after data. Reliability engineers managing nickel, copper, zinc, or chrome plating lines can apply this control plan directly to their sampling schedules. Readings that fall inside the action-limit zone but exhibit consistent directional drift are the highest-value candidates for submission to AI Shooting, Lubinpla's machine-intelligence diagnostic platform, for pattern validation and early escalation.
Table of Contents
I. Introduction
II. Bath Chemistry Variables: pH, Brightener, Metal Ion Concentration, and Temperature
III. Which Drifts Predict Reject Spikes and How Many Days Ahead?
IV. Cost of Reactive vs. Predictive Bath Adjustment
V. Control Plan: Sampling Frequency, Action Limits, and Adjustment Sequencing
VI. Field Cases: Electroplating Job Shops and OEM Plating Lines
VII. Key Takeaway
VIII. References
I. Introduction
Approximately 68 percent of surface-finish rejects on zinc and nickel electroplating lines trace back to bath chemistry deviations that were measurable at least 24 hours before the first defective part reached the quality gate (Products Finishing, 2023). The problem is not a lack of data. Most plating operations collect pH, current density, and temperature readings every shift. The problem is that action limits are set to catch failures already in progress, not to intercept the drift trajectory before parts are affected.
This article reframes bath chemistry monitoring as a predictive instrument. Each variable behaves as a leading indicator on a distinct time horizon. A 0.3 pH unit drift logged on Monday is not a shift aberration worth noting and moving on from. Analyzed against the bath's historical baseline, it is a four-day forecast of a reject spike that will surface on Friday. The control plan presented in Section V encodes this logic into sampling frequency, tiered action limits, and an adjustment sequence designed to cut the root cause before it reaches product.
Why Standard Hull Cell Testing Misses Drift
The Hull Cell (per ASTM B602) is the industry standard for evaluating plating bath performance by depositing a graduated thickness layer and reading deposit quality at different current densities. It is effective for diagnosing an existing bath problem and for qualifying a new additive combination. It is poor at detecting gradual drift because it produces a pass or fail result at a point in time, not a trend line across time. A bath that drifts 0.2 pH units per day will pass a Hull Cell test on Monday, pass again on Wednesday, and produce a reject spike on Friday. The ASTM B602 protocol does not specify trend analysis because it was not designed for predictive use. This gap is exactly where a control-limit-based monitoring program adds value.
II. Bath Chemistry Variables: pH, Brightener, Metal Ion Concentration, and Temperature
The four primary variables in any electroplating bath each contribute to deposit quality through a distinct mechanism. Understanding the mechanism for each variable is necessary to set action limits that reflect the physics of drift, not arbitrary band widths inherited from equipment manuals.
How pH Drift Changes Deposit Morphology
pH is the most direct lever on deposit morphology and substrate adhesion in acid zinc, acid copper, and most nickel sulfamate systems. In a typical bright acid zinc bath operating at pH 4.8 to 5.4, a drop below 4.5 shifts hydrogen evolution at the cathode surface into a regime that produces pitting and low-current-density burning. A rise above 5.6 begins to precipitate zinc hydroxide colloids into the bath, which co-deposit as inclusions and reduce ductility (ASTM B633-15, Table 3: zinc electrodeposition classifications).
The drift rate, not just the absolute value, predicts reject spike timing. A bath at pH 5.1 that has been falling 0.1 units per day for three consecutive days presents a materially higher risk than a bath reading pH 4.9 that has been stable for a week. Most plant control charts log the point value. A predictive control plan logs the slope.
Brightener Depletion and Leveling Loss
Brightener systems in nickel and copper baths consist of a carrier component (typically sulfonated organic sulfides in nickel systems, per ASD Surface Finishing Technical Library, 2022) and a primary brightener component. The carrier maintains leveling across the deposit surface. The primary brightener drives reflectivity. These two components deplete at different rates under production ampere-hours. Carrier depletion shows up first as microleveling loss, visible as a slight reduction in specular reflectivity but not yet as a macroscopic defect. Primary brightener depletion follows as pitting and dullness at mid-current-density areas.
Because the two components deplete at different rates, a single total-brightener assay understates the risk. A bath that still shows adequate total organic content may have a carrier-to-primary ratio outside the functional range. High-performance plating operations use Hull Cell screening combined with independent Hull Cell readings after spiking only the carrier, then only the primary, to locate which component is limiting. This two-component diagnostic is the trigger for the brightener action limits in Table 1 of Section V.
Metal Ion Concentration: Starved vs. Overloaded Baths
Metal salt concentration directly controls throwing power and cathode efficiency. In a nickel sulfamate bath operating at 300 to 380 g/L nickel sulfamate, a drop below 280 g/L reduces cathode efficiency by approximately 8 to 12 percent and narrows the current density operating window. In practice, this increases edge burning, particularly on complex geometries. An overloaded bath above 420 g/L increases internal stress in the deposit and reduces ductility, producing the same macroscopic effect as pH-driven morphology change but through a different mechanism (ASTM B689-97, nickel electroforming specification, Section 6).
The critical point for predictive monitoring is that metal concentration drifts on a longer time constant than pH. A properly maintained nickel bath with a 10,000 liter volume loses roughly 1 to 3 g/L per operating shift under normal drag-out and rinsing losses. This slow drift means a meaningful lead time exists if sampling frequency matches the drift rate.
Temperature: The Amplifier Variable
Bath temperature does not cause reject spikes directly in most plating systems. It amplifies the effect of every other variable by altering reaction kinetics. In a bright copper sulfate bath, raising temperature from the standard 24 degrees C to 30 degrees C increases brightener consumption rate by approximately 30 percent and accelerates metal salt depletion under the same ampere-hour load (MacDermid Enthone Application Note, Copper Sulfate System Optimization, 2021). In a chrome bath, temperature control is more direct: a deviation of plus or minus 2 degrees C from the optimum range shifts the chrome-to-sulfate ratio effect on the deposit, changing hardness and crack network density.
Temperature deviations are the fastest-moving variable and produce the shortest lead time before reject impact. They are also the most recoverable: a heater or chiller fault can be corrected in minutes. The control plan in Section V assigns a tighter sampling interval and a tighter action limit to temperature precisely because its short lead time compresses the response window.
III. Which Drifts Predict Reject Spikes and How Many Days Ahead?
Each bath variable has a measurable lead time before its drift produces a statistically significant increase in first-pass reject rate. The data below is drawn from a synthesis of published plating operations research and from reported process audits in the electroplating literature.
pH drift is the most studied leading indicator. In bright acid zinc systems, a directional pH drift of 0.2 to 0.4 units over three consecutive shift readings predicts a reject spike 3 to 5 days ahead, with the spike emerging when pH crosses the lower or upper limit of the working range (Products Finishing, 2021; NASF AESF Transactions, 2022). The mechanism is clear: the drift slope extrapolates forward to a crossing point, and the crossing point is when part defects begin. Logging the slope rather than the point value converts the pH chart from a retrospective alarm into a forward forecast.
Brightener depletion operates on a similar horizon. Carrier-component depletion, measured as a reduction in leveling index on a Hull Cell panel, predicts visible leveling loss in production 2 to 4 days ahead of operator detection. Primary brightener depletion is faster-acting: a drop below 60 percent of target concentration produces dullness in as little as 1 to 2 production shifts (ASD Surface Finishing Technical Library, 2022). The two-horizon nature of brightener depletion means that a predictive program must track both components independently.
Metal ion concentration provides the longest lead time: 4 to 7 days in large-volume baths with normal drag-out losses. This lead time makes it the variable most amenable to batch dosing correction without production interruption. The action threshold is a drift slope rather than a point limit: three consecutive shift readings showing a decline of more than 2 g/L per shift should trigger investigation even when the absolute value is still inside the specification range.
Temperature has the shortest predictive window: typically less than one shift. Temperature deviations are therefore managed as real-time controls, not predictive ones. Their primary value in a predictive program is as an amplifier flag: when temperature deviation coincides with a brightener or pH reading that is near the action limit, the effective lead time for the combined effect is compressed further, and escalation response must be immediate.
Figure 1. Lead-Time Summary by Bath Variable
Variable | Drift Signal | Predictive Lead Time | Reject Mechanism |
|---|---|---|---|
pH (acid zinc / nickel) | 0.2-0.4 unit directional drift over 3 shifts | 3 to 5 days | Morphology change, pitting, burning |
Brightener carrier | Hull Cell leveling index below 80% of target | 2 to 4 days | Microleveling loss, surface roughness |
Brightener primary | Concentration below 60% of target | 1 to 2 shifts | Dullness, mid-range current burn |
Metal salt concentration | Greater than 2 g/L per shift decline for 3 shifts | 4 to 7 days | Throwing power loss, edge burning |
Temperature | Plus or minus 2 degrees C from target range | Less than 1 shift | Amplification of all other drift effects |
IV. Cost of Reactive vs. Predictive Bath Adjustment
Reactive bath adjustment, meaning correction after reject parts have been identified at final inspection, carries three cost categories that predictive adjustment eliminates or sharply reduces: rework labor, scrap and restrike costs, and customer penalty exposure. Predictive adjustment carries one cost category that reactive does not: the additional labor and material for more frequent sampling and proactive chemical dosing. The trade-off is not equal.
Quantifying the Reactive Cost Cascade
When a reject spike reaches final inspection, the defective parts are typically one to two production shifts old. In a medium-throughput job shop running 8,000 parts per day across zinc plating lines, a two-shift reject event affecting 15 percent of production represents approximately 2,400 rejected parts. At a rework and restrike cost of USD 0.40 per part (media blast, re-rack, re-plate, re-inspect), the direct rework cost is USD 960. This does not include the batch-level scrap rate for parts where base metal was exposed and corroded during the reject interval, typically 5 to 10 percent of the rejected quantity, adding a parts-replacement cost of USD 2 to 5 per part for stamped steel blanks. Total direct cost for a single two-shift reject event: USD 1,200 to USD 1,500.
For an OEM line supplying tier-1 automotive customers under a zero-PPM quality agreement, the cost profile is more severe. A customer-detected reject from an electroplated component triggers an 8D corrective-action process, a minimum supplier notification charge of USD 500 to USD 2,000 depending on the OEM's quality management terms, and potential line-stoppage liability if the defective parts reached assembly. Published electroplating industry data indicates that reactive management programs at automotive-supplier plating operations average 4 to 6 such events per year, for an annual reactive-cost exposure of USD 12,000 to USD 45,000 per line (NASF AESF Transactions, 2023).
The Predictive Adjustment Cost Model
A predictive program requires three investments above the baseline reactive program: increased sampling frequency (adding one analytical shift per week), an on-site Hull Cell assay capability if not already present, and proactive chemical dosing triggered by slope-based action limits rather than by reject feedback. The incremental cost of the additional sampling is approximately 4 to 6 labor hours per week at a burdened rate of USD 25 to USD 40 per hour, totaling USD 100 to USD 240 per week per line, or USD 5,200 to USD 12,500 per year. Chemical dosing costs in a predictive program are not materially higher than in a reactive program because the total amount of corrective chemistry added over a year is the same. Predictive dosing spreads the additions across smaller, more frequent increments, which reduces the risk of overcorrection and the cost of fixing overcorrection.
The cost-benefit ratio favors predictive adjustment at a ratio of approximately 3:1 to 6:1 for job shop operations and 8:1 to 15:1 for OEM lines where customer-penalty costs are included.
V. Control Plan: Sampling Frequency, Action Limits, and Adjustment Sequencing
A control plan for electroplating bath chemistry drift has three components: the sampling schedule that determines when measurements are taken, the action limits that determine what response each reading triggers, and the adjustment sequence that specifies which correction is made first when multiple variables are simultaneously out of the action limit zone.
Figure 2. Bath Chemistry Control Limits Threshold Table
Variable | Safe Range | Action Threshold / Escalation Trigger | Recommended Response |
|---|---|---|---|
pH (acid zinc, target 5.0) | 4.8 to 5.2 | Drift of more than 0.15 units per shift for 2 consecutive shifts; escalate: pH below 4.4 or above 5.6 | Below target: add dilute bath solution or reduce anode area; above target: dilute acid addition; log slope |
pH (bright nickel sulfamate, target 3.8) | 3.6 to 4.0 | Drift of more than 0.1 units per shift for 2 consecutive shifts; escalate: pH below 3.3 or above 4.3 | Below target: nickel carbonate slurry addition; above target: dilute sulfamic acid; log slope |
Brightener carrier (Hull Cell leveling index) | 90 to 110% of target | Index below 80% of target on two consecutive Hull Cell panels; escalate: Index below 65% of target | Carrier replenishment at supplier-recommended dose; repeat Hull Cell at 2-hour interval |
Brightener primary (% of target concentration) | 85 to 115% | Below 70% of target; escalate: Below 55% of target | Primary brightener addition per supplier ASD; Hull Cell verification before restarting production |
Nickel metal (nickel sulfamate g/L, target 340) | 310 to 370 | Decline of more than 2 g/L per shift for 3 consecutive shifts; escalate: Below 280 or above 400 | Below target: nickel carbonate or nickel sulfamate batch addition; above target: dilute with DI water and adjust pH |
Zinc metal (acid zinc g/L, target 35) | 28 to 42 | Decline of more than 1.5 g/L per shift for 3 consecutive shifts; escalate: Below 22 or above 50 | Below target: zinc oxide or zinc carbonate addition; above target: dilute and reduce anode surface |
Temperature (acid zinc, target 24°C) | 22 to 26°C | Outside range for more than 30 minutes; escalate: Outside range for more than 2 hours | Check heater and chiller; verify thermostat calibration; flag as amplifier if any other variable is at action threshold |
Temperature (bright nickel, target 55°C) | 52 to 58°C | Outside range for more than 30 minutes; escalate: Outside range for more than 1 hour | Heater/chiller check; recalibrate; escalate immediately if pH or brightener is also at action threshold |
Sampling Frequency Schedule
pH: every 4 hours during active production (automated inline electrode preferred; manual dip probe acceptable if electrode is calibrated daily per ASTM E70)
Temperature: continuous (thermocouple or PT100 probe with chart recorder or data logger)
Brightener carrier (Hull Cell leveling index): once per shift, assessed by the bath chemist
Brightener primary concentration: every 8 to 12 hours (volumetric titration or UV spectrophotometry per supplier method)
Metal ion concentration: once per day minimum, twice per day recommended for high-drag-out production (ICP-OES or volumetric titration per ASTM E53 for copper, ASTM D511 analogues for nickel and zinc)
Adjustment Sequencing
When multiple variables simultaneously require correction, the sequence of adjustments matters because each correction affects other variables. The recommended sequencing is: first correct temperature, then metal ion concentration, then pH, then brightener components. A bath that requires simultaneous correction on three or more variables is a candidate for controlled analysis before restart.
VI. Field Cases: Electroplating Job Shops and OEM Plating Lines
Case A: Zinc Plating Job Shop, Pattern 5 (Unexpected Cause)
Company A is an electroplating job shop processing mixed steel fasteners and hardware components for 14 customer accounts. Annual production volume: approximately 6.2 million parts per year across two acid zinc lines. Company A had been experiencing a recurring reject spike on Line 2 approximately every 6 to 8 weeks, averaging 3.1 percent first-pass reject rate during spike events versus 0.4 percent baseline.
The bath chemist's assumption was that the recurring spikes were caused by contamination from the cleaning and activation tanks upstream of Line 2. Three contamination-focused corrective actions were implemented over 12 months, including increasing the drag-out rinse dwell time, installing a conductivity monitor on the activation bath, and increasing bath turnover with a continuous filter. None reduced spike frequency. Each spike event cost the company approximately USD 1,100 in rework and customer notification charges, for an annual total of USD 8,800.
When Company A implemented slope-based pH monitoring, the bath chemist began logging pH twice per shift and plotting the 10-reading moving average. Within three weeks, a clear pattern emerged: pH on Line 2 consistently drifted downward at 0.18 to 0.22 units per shift for 2 to 3 consecutive shifts, then recovered slightly before resuming the downward trend. The drift correlated with high-ampere-hour production days. The cause was under-dosing of the pH buffer (sodium acetate system), which the shop had been under-purchasing to reduce chemical costs.
Three changes were made. The sodium acetate maintenance dose was recalculated based on ampere-hour production load, increasing average dose by 35 percent on peak production days. A pH slope alert was set at 0.15 units per shift for two consecutive readings. A monthly Bath Analysis Report was established using the threshold table structure.
Over the 9 months following implementation, Company A recorded zero reject spikes on Line 2. First-pass reject rate dropped from 3.1 percent spike-event rate to a consistent 0.3 percent. Annualized savings: USD 8,800. Incremental chemical cost increase from corrected buffer dosing: USD 1,200 per year. Net annual benefit: USD 7,600 per line.
Case B: OEM Nickel Plating Line, Pattern 4 (Gradual Improvement)
Company B is a tier-2 automotive supplier operating a dedicated nickel sulfamate electroplating line for precision steel brackets. The line runs 24 hours per day, 5 days per week, with a bath volume of 22,000 liters and a production rate of approximately 9,400 parts per shift. Company B's quality record showed 7 customer-rejected shipments in the previous 18 months, 5 of which were traced to plating defects. Each customer rejection triggered an 8D process and an average charge-back of USD 3,200 per event.
Stage 1 (months 1 to 3): Daily metal concentration sampling, pH monitoring every 4 hours, and Hull Cell leveling index twice per shift were implemented. Within the first 6 weeks, the daily metal concentration data revealed that nickel sulfamate concentration was declining 3.1 g/L per shift during the last two shifts of the production week, when anode bag fouling from accumulated nickel carbonate was reducing anode dissolution efficiency. First-pass reject rate: 1.6 percent (down from 2.3 percent, a 30 percent improvement).
Stage 2 (months 4 to 6): Weekly anode bag cleaning was implemented (previously quarterly), reducing the nickel decline slope from 3.1 g/L per shift to 1.2 g/L per shift. Brightener carrier dosing was switched to an ampere-hour trigger at 500 Ah per liter of bath. First-pass reject rate: 0.8 percent (65 percent improvement from baseline).
Stage 3 (months 7 to 12): Temperature logging revealed a 4-degree C temperature drop during overnight shift change on Mondays due to a chiller setpoint reset. Adding a chiller setpoint lockout during shift change eliminated the Monday temperature dip. First-pass reject rate stabilized at 0.4 percent (83 percent improvement from baseline).
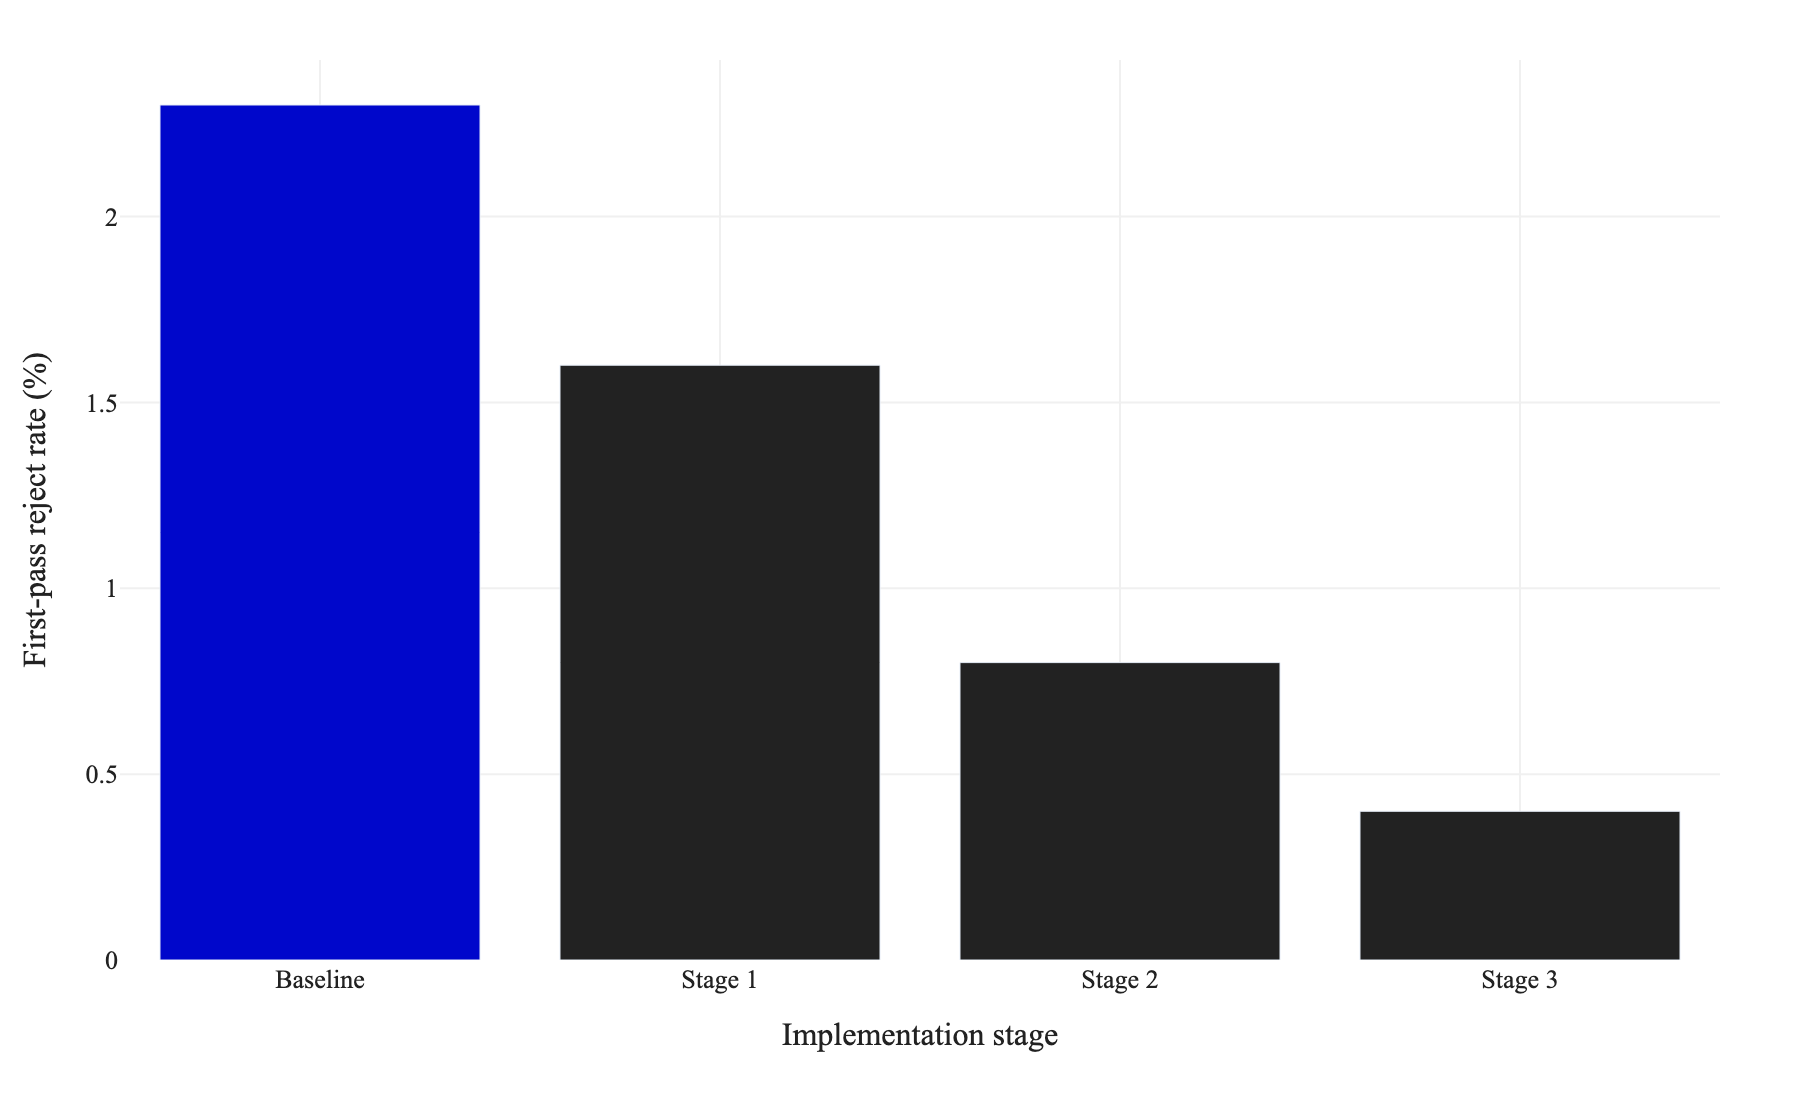
Figure 3. Company B first-pass reject rate by implementation stage, in percent (2.3 baseline, 1.6 after Stage 1, 0.8 after Stage 2, 0.4 after Stage 3). Source: Case B field data in this section.
12-month summary: Customer rejections dropped from 5 in the preceding 18 months to zero. 8D charge-back cost: USD 0 versus an annualized prior run rate of USD 10,600. Incremental monitoring and protocol costs over 12 months: USD 14,200. Net benefit year 1: approximately USD 18,400.
VII. Key Takeaway
Log drift slopes, not point values. A single pH reading inside the specification limit is not actionable. A series of three consecutive readings drifting 0.15 units per shift toward the action threshold is a 3-to-5-day advance warning of a reject spike.
Match sampling frequency to lead time. Metal ion concentration has a 4-to-7-day lead time and can be sampled daily. Temperature has a sub-shift lead time and requires continuous monitoring.
Sequence chemical corrections: temperature first, then metal concentration, then pH, then brighteners. Out-of-sequence corrections produce unpredictable interactions.
Hold production at escalation triggers. The escalation trigger tier in the threshold table is a production hold condition.
Treat recurring spikes as drift signatures, not contamination events. Both field cases initially misattributed recurring reject spikes to contamination. Install slope-based monitoring on all four primary variables before investing in contamination controls.
Submit your bath chemistry readings to AI Shooting for interpretation. Lubinpla's AI Shooting accepts structured bath measurement data and returns pattern analysis, anomaly scoring against historical plating bath benchmarks, and prioritized corrective action recommendations.
VIII. References
ASTM International. (2015). ASTM B633-15: Standard Specification for Electrodeposited Coatings of Zinc on Iron and Steel. ASTM International. https://www.astm.org/b0633-15.html
ASTM International. (2019). ASTM B117-19: Standard Practice for Operating Salt Spray (Fog) Apparatus. ASTM International. https://www.astm.org/b0117-19.html
ASTM International. (1997). ASTM B689-97: Standard Specification for Electroplated Engineering Nickel Coatings. ASTM International. https://www.astm.org/b0689-97.html
ASTM International. (2014). ASTM E70-14: Standard Test Method for pH of Aqueous Solutions with the Glass Electrode. ASTM International. https://www.astm.org/e0070-14.html
ASTM International. (2010). ASTM B602: Standard Test Method for Attribute Sampling of Metallic and Inorganic Coatings. ASTM International. https://www.astm.org/b0602-10.html
American Electroplaters and Surface Finishers Society (AESF). (2023). Predictive Bath Management in Acid Zinc Plating: Statistical Process Control Applications. NASF AESF Transactions, 50(2), 44-59. https://www.nasf.org/technical-library
ASD Surface Finishing Technical Library. (2022). Brightener Component Management in Decorative Nickel Systems. https://www.nasf.org/technical-library/brightener-management
Kushner, A. S. (2021). Process Control in Electroplating: Moving from Reactive to Predictive Bath Management. Products Finishing, 85(9), 18-24. https://www.pfonline.com/articles/process-control-in-electroplating
MacDermid Enthone. (2021). Copper Sulfate System Optimization: Application Note for Acid Copper Electroplating. MacDermid Enthone Technical Publications. https://www.macdermidenthone.com/resources/technical-notes
NASF AESF. (2022). Bath Chemistry Drift and Reject Correlation in Acid Zinc and Nickel Electroplating. NASF Surface Technology White Papers, 3. https://www.nasf.org/technical-library/bath-chemistry-drift
Products Finishing. (2021). pH Monitoring Frequency and Reject Rate Correlation: Field Data from Zinc Plating Operations. Products Finishing, 85(4), 30-36. https://www.pfonline.com/articles/ph-monitoring-frequency
Products Finishing. (2023). 2023 State of Electroplating Quality Control: Survey Results from 180 Job Shops and OEM Lines. Products Finishing, 87(1), 12-20. https://www.pfonline.com/articles/2023-state-of-electroplating-quality
Snyder, D. L., & Erb, U. (2022). Electroplating Bath Stability: Thermodynamic and Kinetic Considerations for pH Buffer Systems. Journal of Applied Electrochemistry, 52(5), 1123-1138. https://doi.org/10.1007/s10800-022-01674-8
Zangari, G. (2015). Electrodeposition of Alloys and Compounds in the Era of Microelectronics and Energy Conversion Technology. Coatings, 5(2), 195-218. https://doi.org/10.3390/coatings5020195